By Ross Turner, National Director, Commercial Agri Advisory
The headlines
-
Opteon’s in-house data analysts have analysed more than 3,500 sales (Q2 2019 – Q2 2021) of commercial, industrial and retail assets in the <$5m category.
-
Overall, these remain stable asset classes in a positive market – aided by low interest rates. We are yet to see the impacts of the latest round of lockdowns on property markets.
-
From our empirical data and our anecdotal evidence, we have also identified clear market trends regarding asset class performance and yields.
-
For investors and financiers, these insights provide a clear picture of recent market performance in the <$5m asset classes.
Industrial
With the prevalence of online shopping, demand for warehouses and logistic properties meant industrial property remained a resilient asset class. Whilst not surprisingly Industrial has won the title as the strongest and most consistent performer, attributed by consistent sales volumes, steady yield compression and price growth over the last 12 months. There are always potential risks however with sectors that have the benefit of spotlight and the lion share of investment, and the question is raised, at historical low cap rate levels, in an asset class where rental growth is more closely aligned to CPI growth rather than other metrics, does the asset class provide the best value moving into 2022?
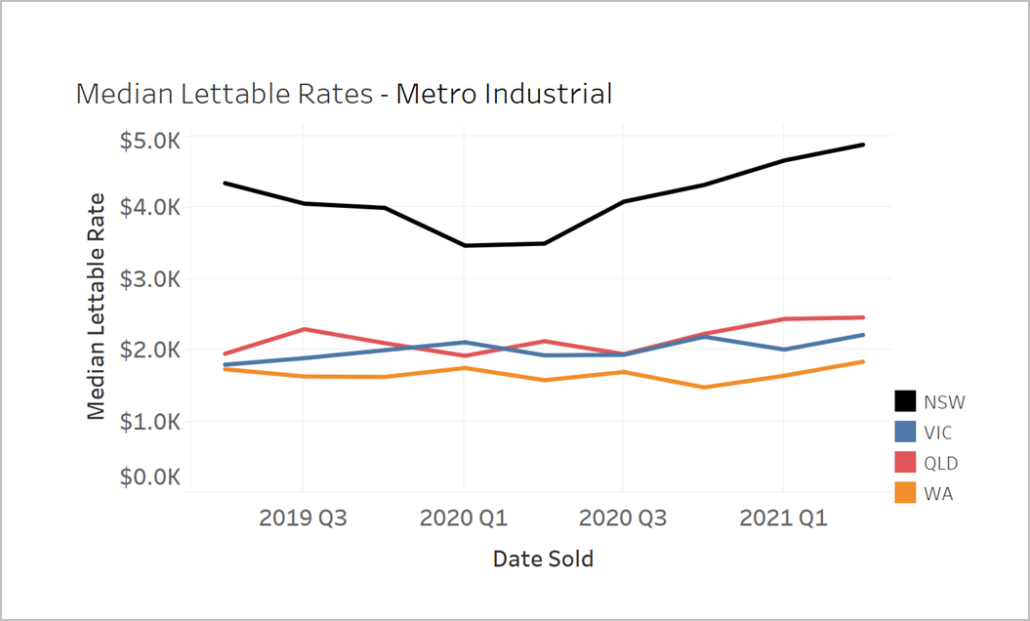
Lettable rates
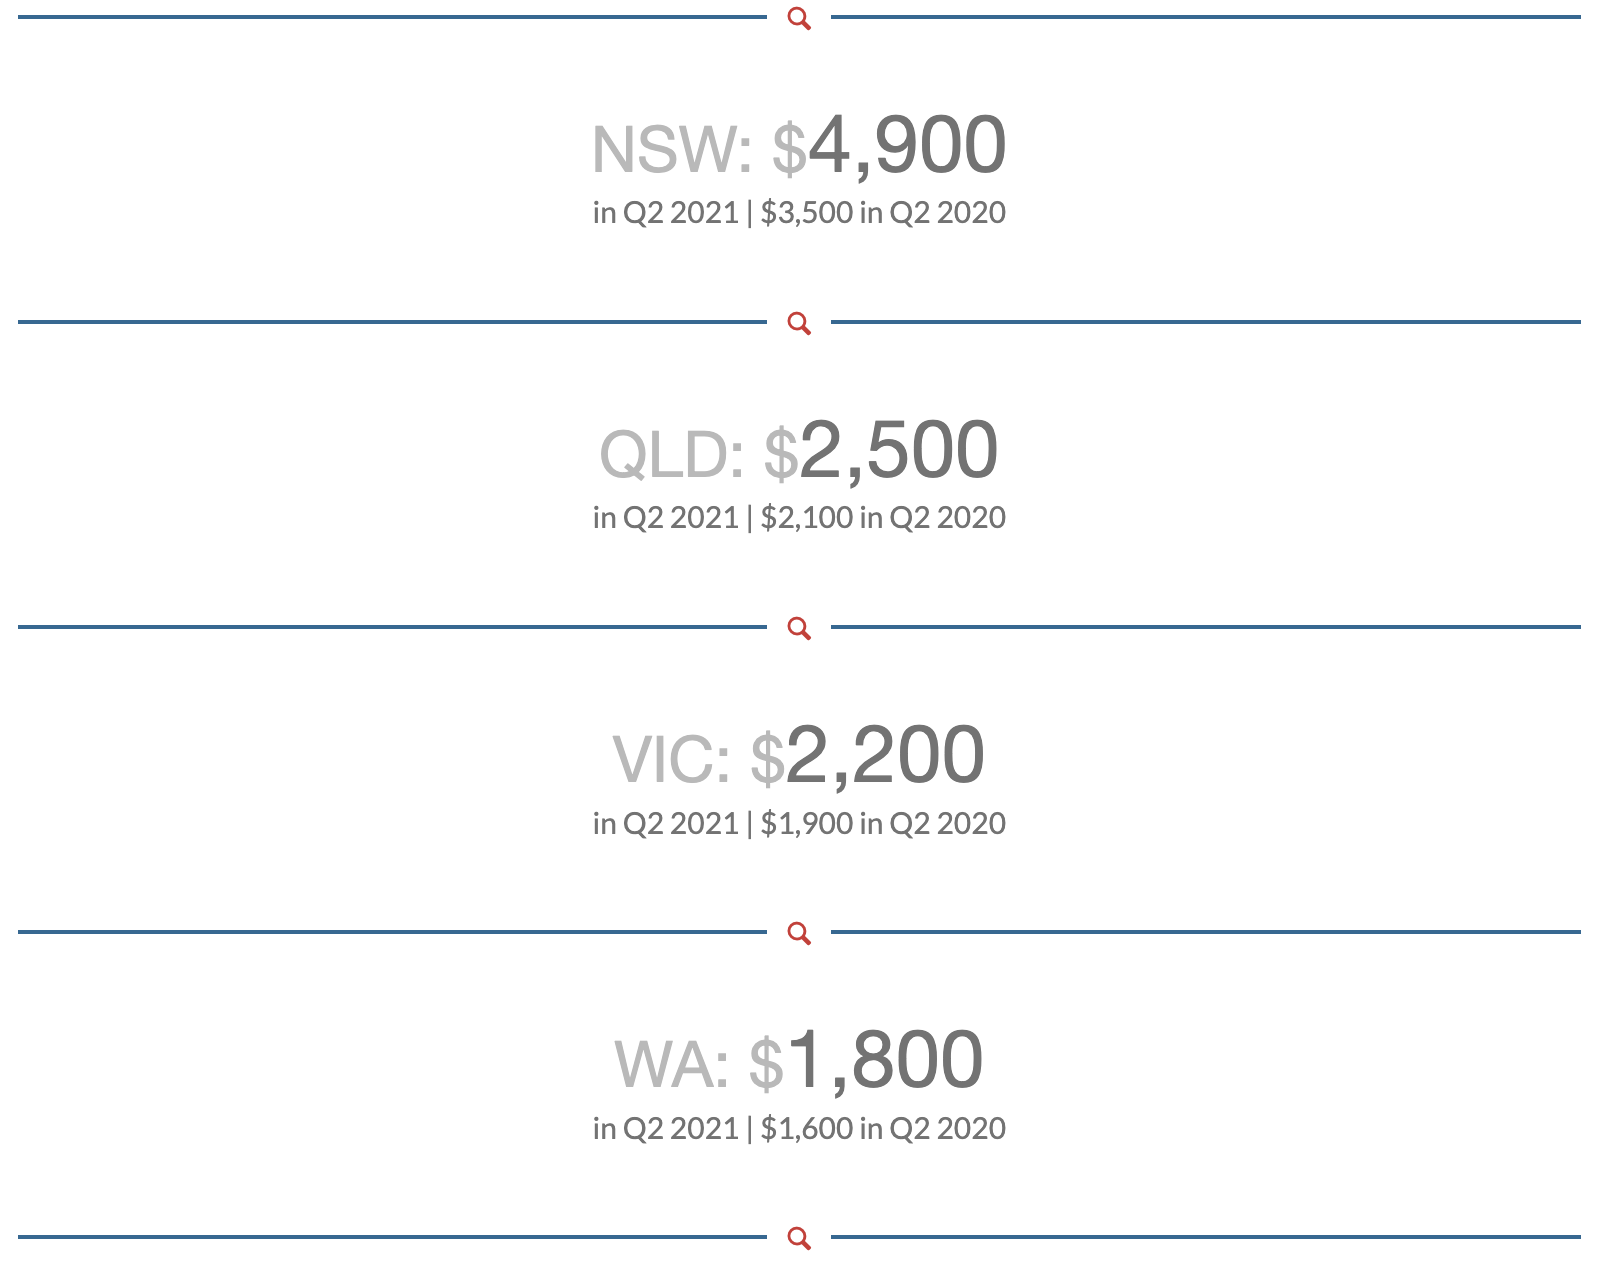
There has been no significant change seen in industrial median lettable rates in Victoria or WA.
Whilst prime metro Perth Markets have seen lettable area growth, this has been offset by a stabilisation of rates in secondary markets following historical period of decline.
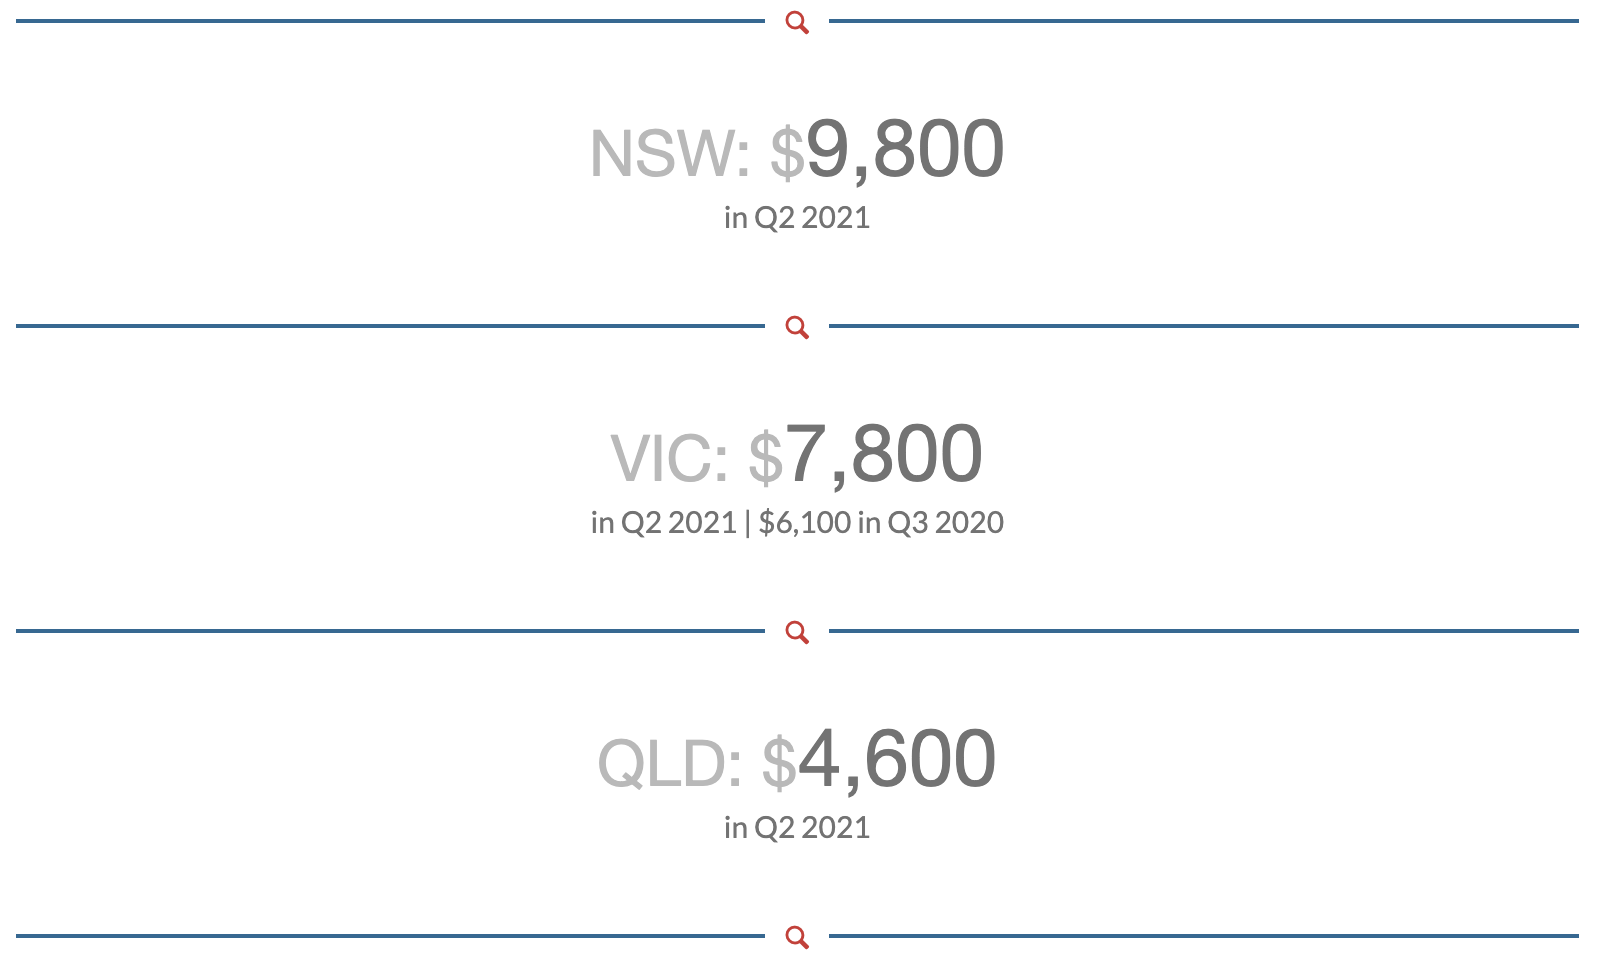
In NSW, rates fell in early 2020 but have increased every quarter since Q2 2020. Rates have also been climbing in Queensland.
Note: These figures have been rounded to the nearest 100
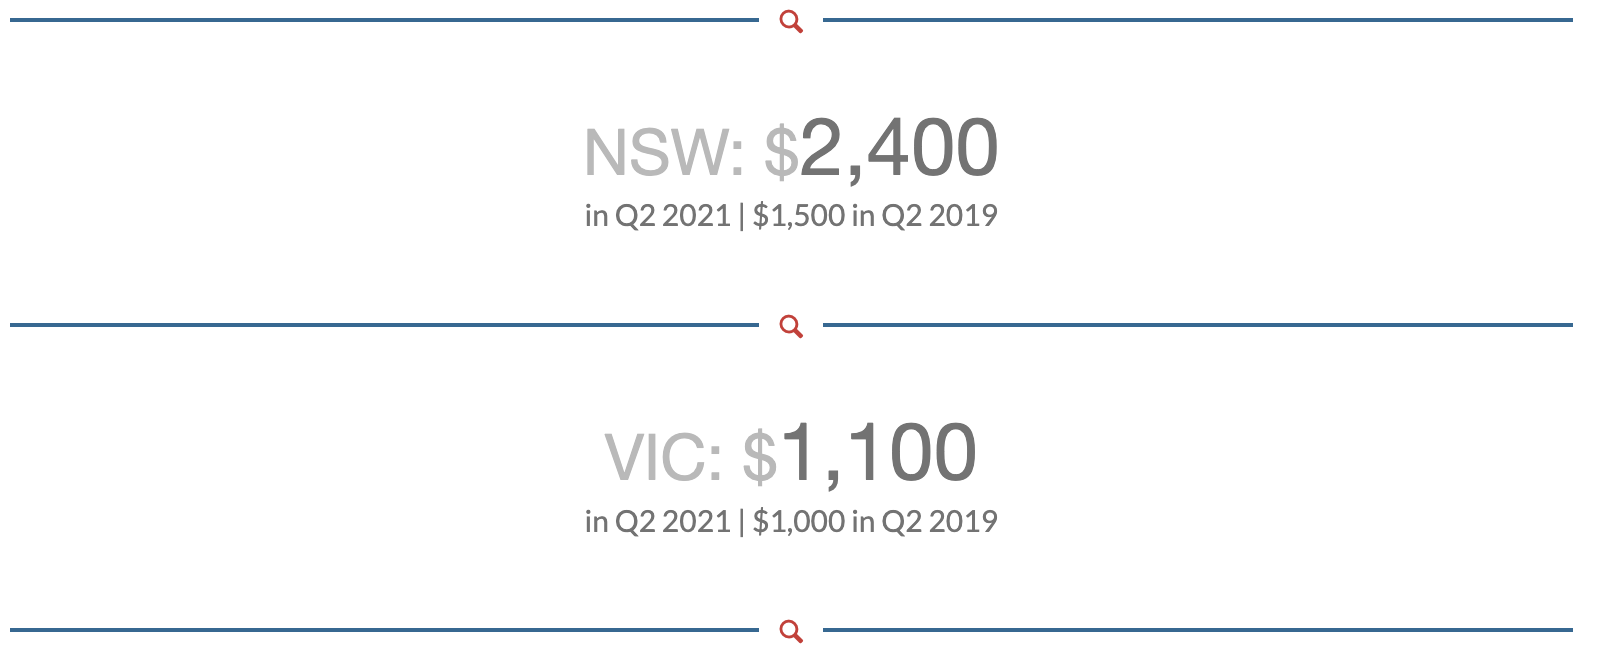
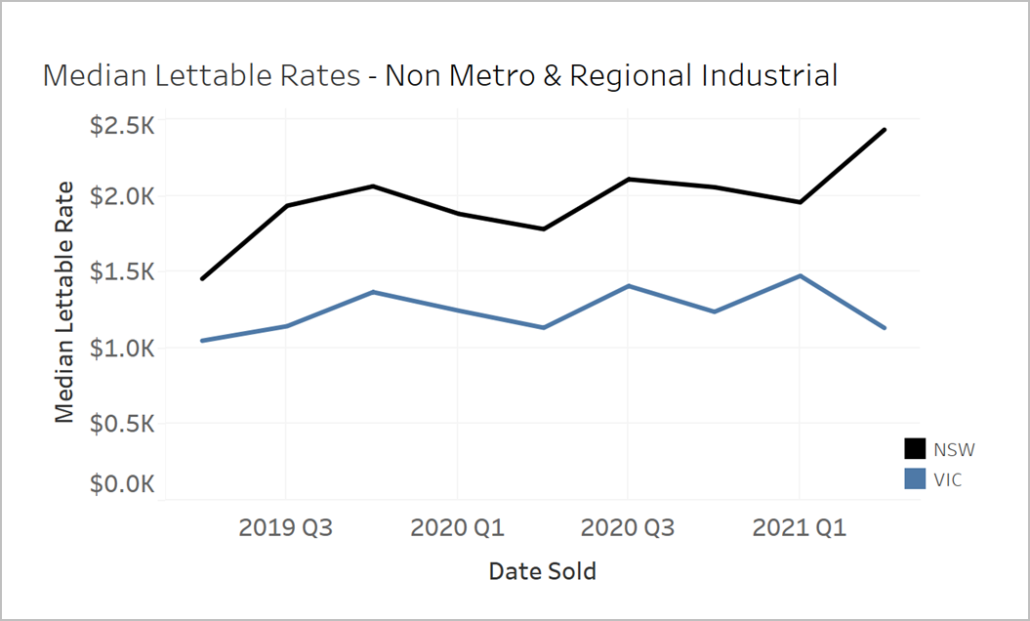
There was a stark contrast in the lettable rate ranges for NSW warehouses compared to industrial property in the other states, reflecting the tight land supply in NSW, several high-value sales and its more populous metropolitan area.
Lettable rates were also higher in non-metro and regional areas of NSW than in non-metro and regional areas of VIC and continue to climb.
Note: These figures have been rounded to the nearest 100
Yield
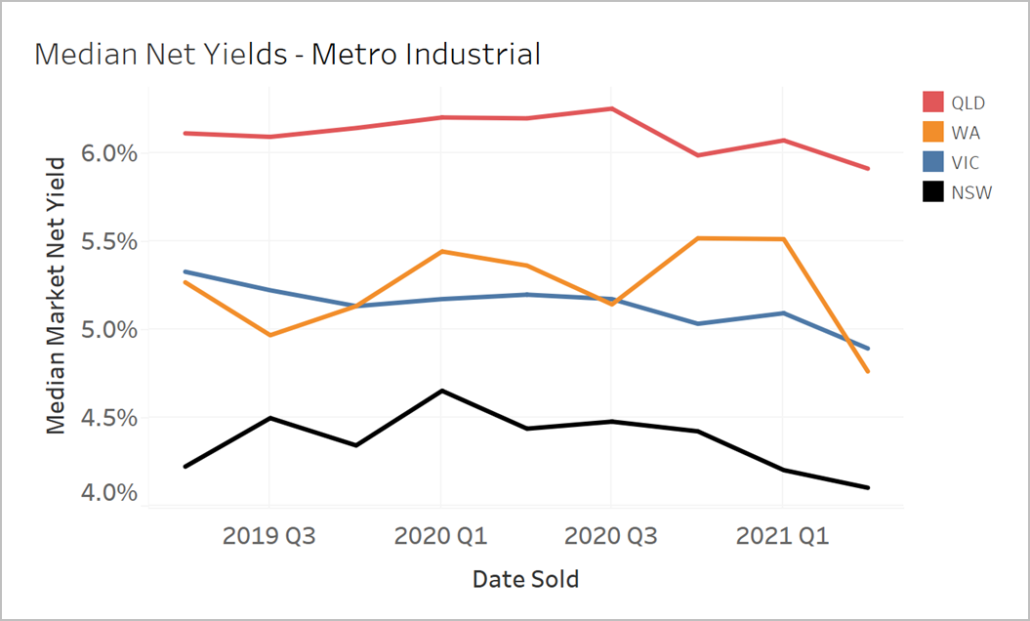
With metro NSW having the highest lettable rates, this measure also translated in the region with the lowest market net yields due to value rates increasing – the median was 4.1% in Q2 2021.
Metro net yields were highest in Queensland, but the median yield dropped from 6.1% in Q2 2019 to 5.9% in Q2 2021.
Yields in metro Victoria have been falling – from 5.3% in Q2 2019 to 4.9% in Q2 2021.
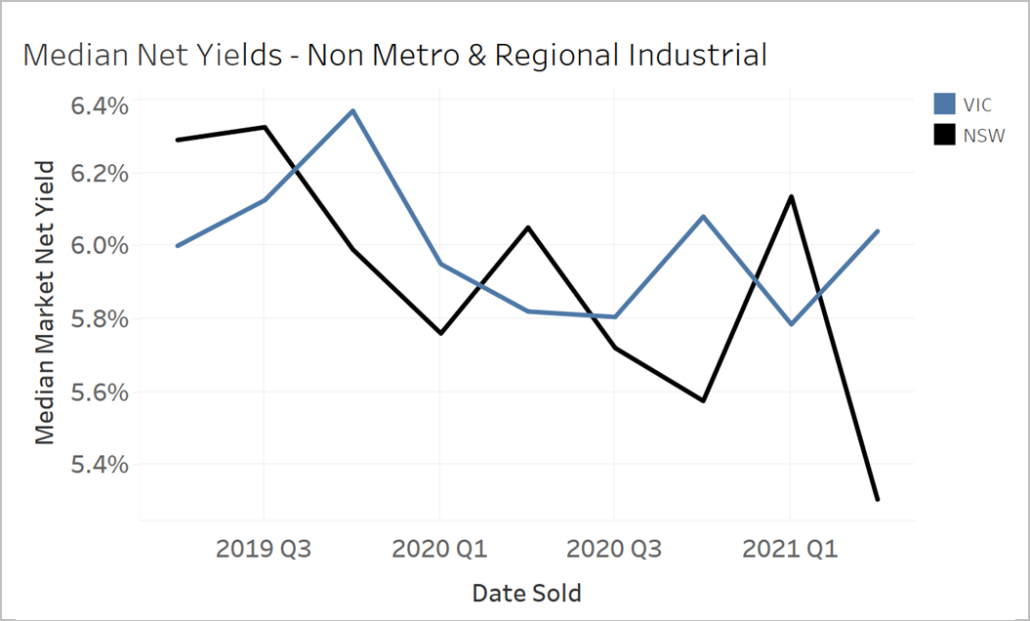
Yields in non-metro and regional NSW fell from a median of 6.3% in Q2 2019 to 5.3% in Q2 2021.
In Western Australia, a robust resources industry has resulted in a significant increase in acquisition activity within the prime Perth metropolitan industrial markets during early 2021. This activity has influenced net yield compression.
Retail
Lettable rates
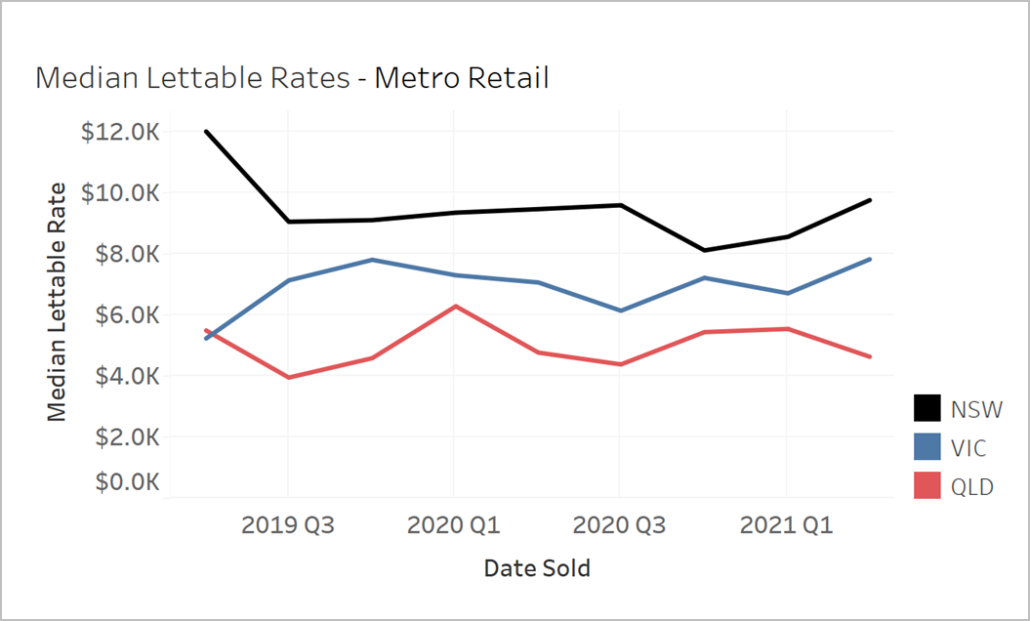
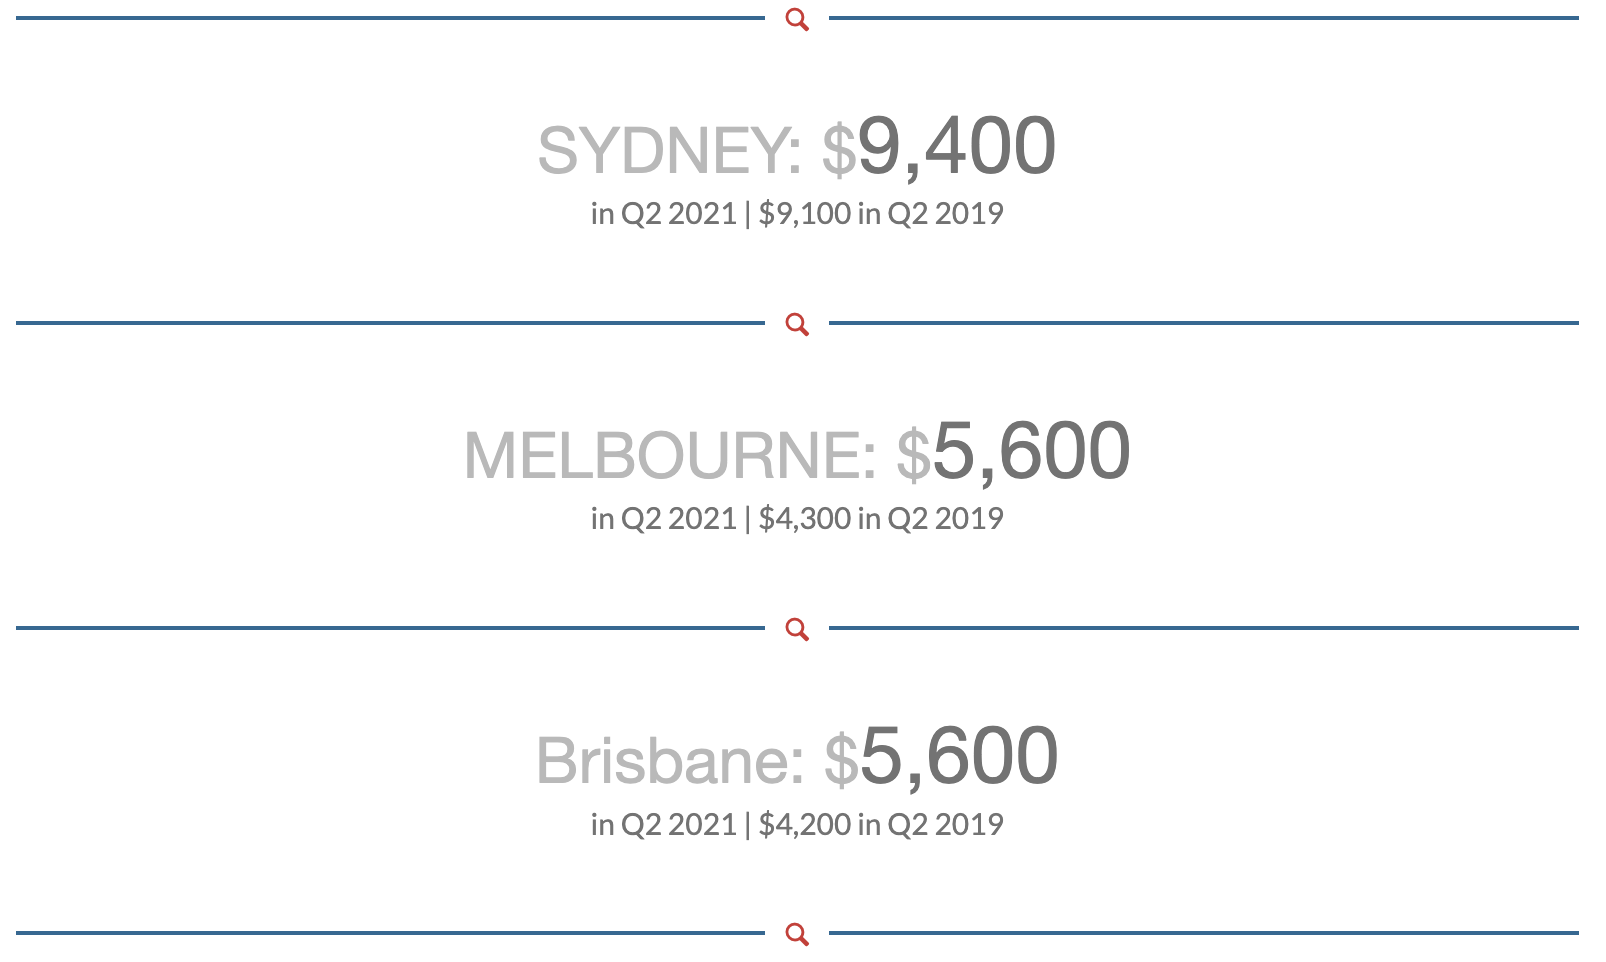
Retail property lettable rates reflected the COVID-19 lockdown story in metropolitan areas. Melbourne’s lockdowns during Q2 2020 and Q3 2020 saw rates dip in Melbourne but have since recovered.
Note: These figures have been rounded to the nearest 100
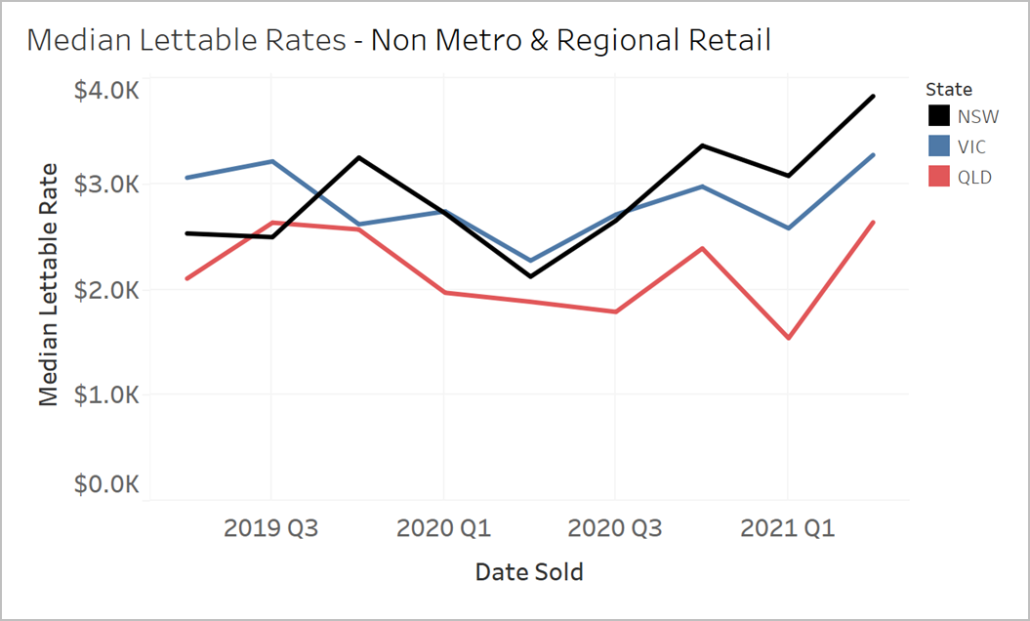
Across the regions, an interesting takeout from recent Opteon analysed sales data has seen surprising recovery and growth from Q1 2021.
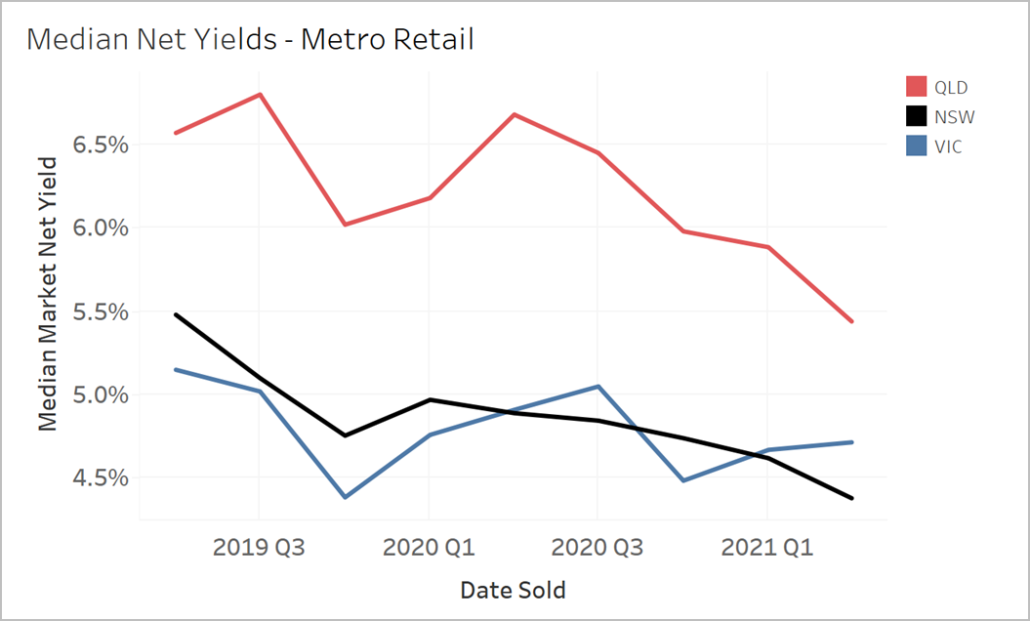
Yields
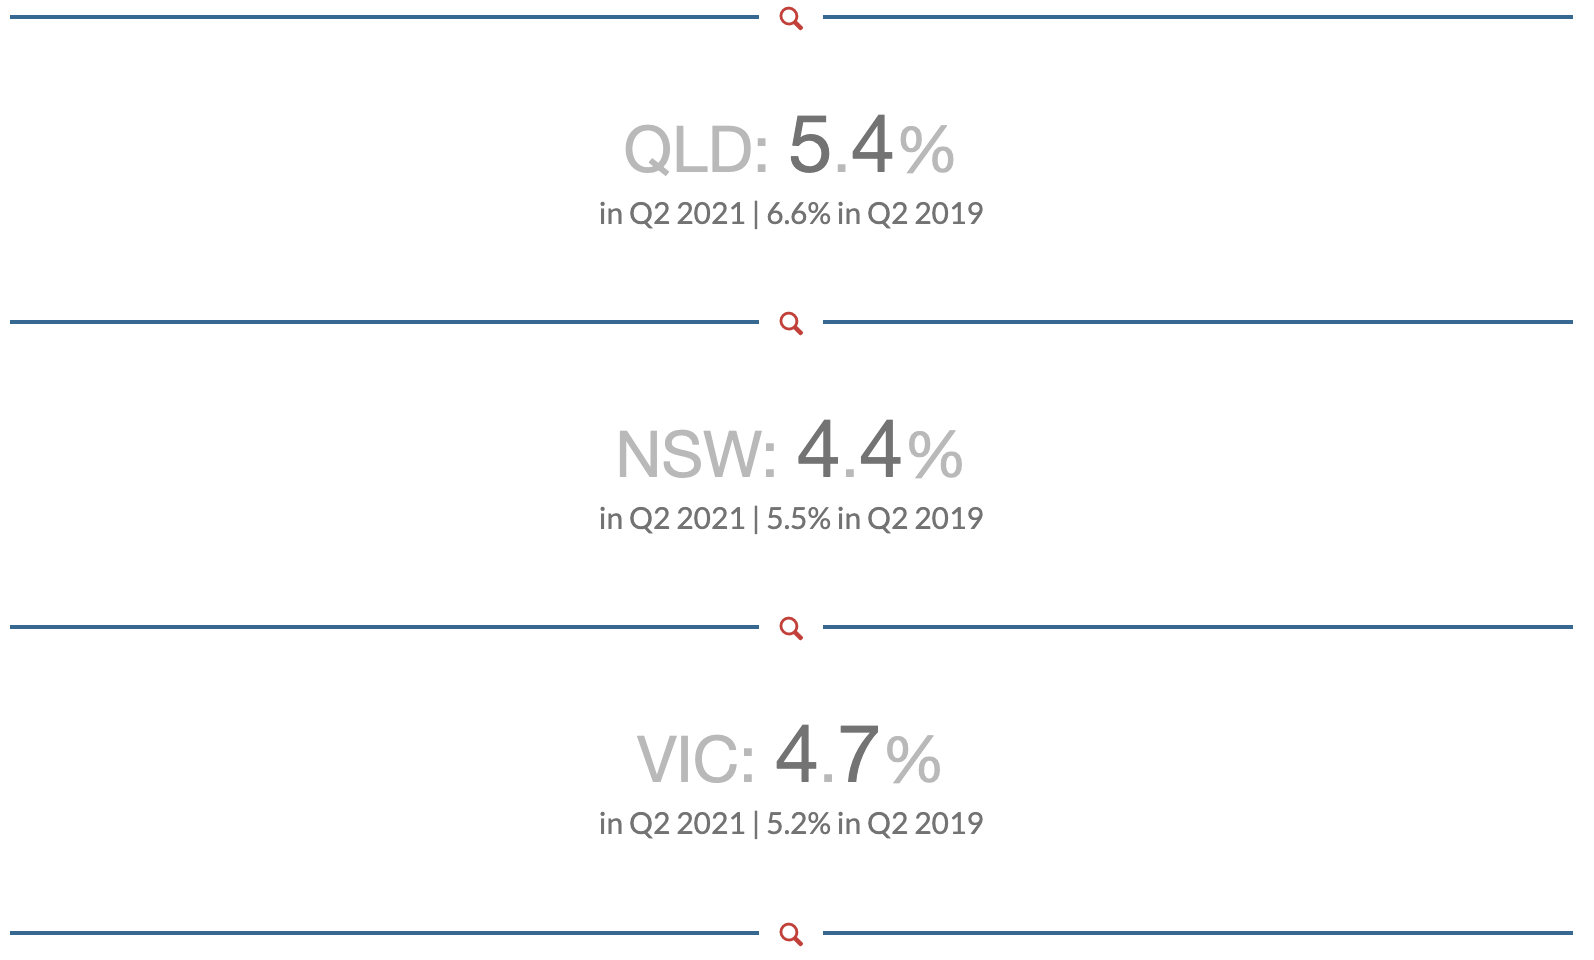
Net yield in metro NSW and metro Queensland has been dropping since Q2 2019. Retail yields in Vic appear to have risen slightly in Q1 due to the uncertainty of the post pandemic behaviour of customers (again, prior to entering another lengthy lockdown in the middle of the year)
Note: These figures have been rounded to the nearest decimal place.
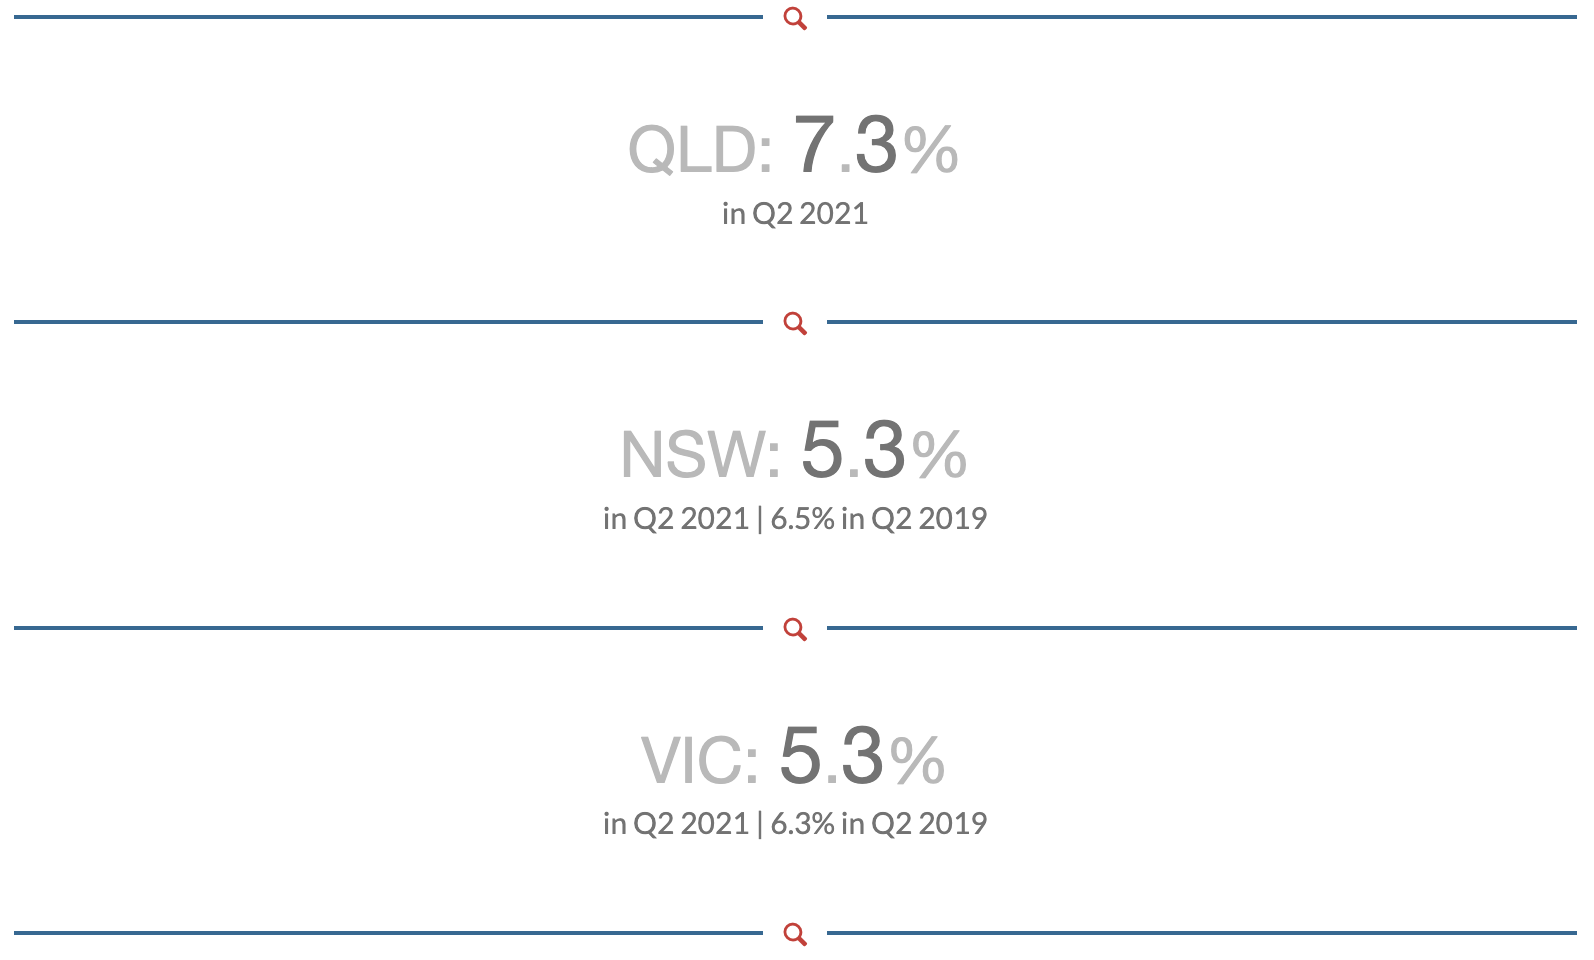
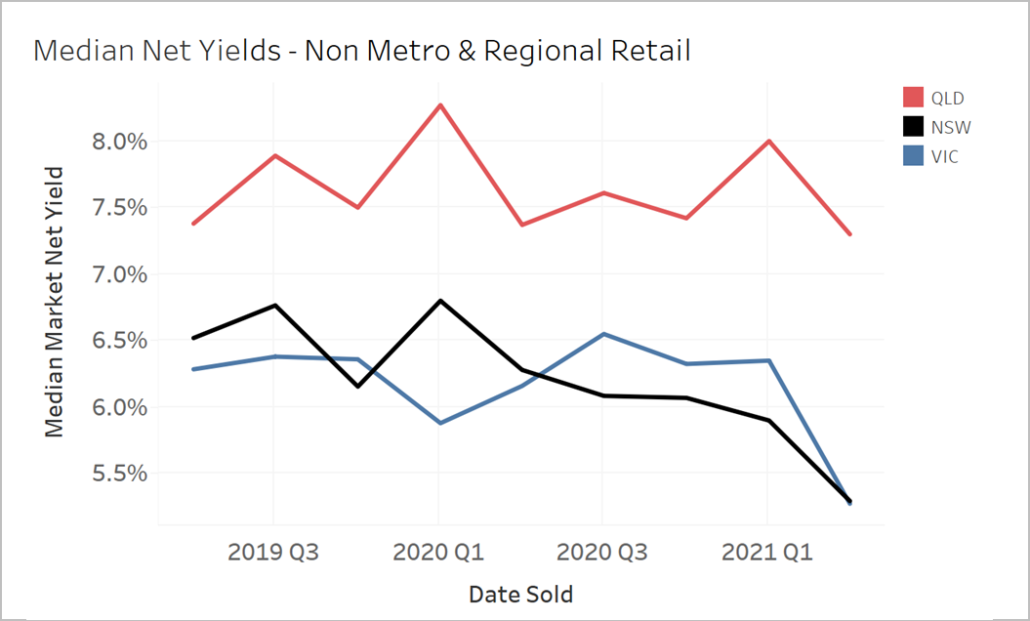
Yields have also been falling in non-metro and regional areas of Victoria and NSW since Q2 2019.
Note: These figures have been rounded to the nearest decimal place.
Commercial
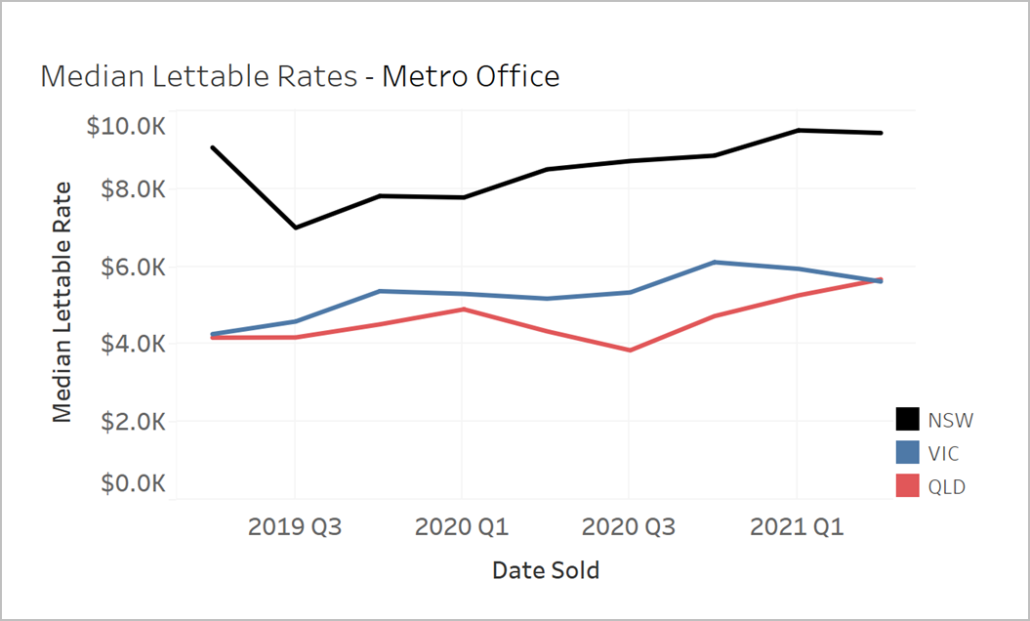
Lettable rates
Lettable rates in the Sydney metro area have been increasing since Q3 2019. Melbourne remained relatively stable, despite extensive shutdowns, likely reflecting market resilience that was boosted by JobKeeper and low interest rates but began falling after Q4 2020.
Note: These figures have been rounded to the nearest 100.
Current trends
Overall, the locational characteristics of the office property markets remained strong throughout the year. This was likely to have been aided by low interest rates and JobKeeper, which helped tenants weather short-term softening. Whilst further quarters will show how office markets have performed with post JobKeeper, initial data indicates a pathway to recovery.
In terms of median lettable rates, NSW continued to outperform the other states in every quarter across the asset classes.
The most notable tightening of yields have been in NSW warehouses and regional retail properties. The regional market is performing strongly, in part due to the residential treechange/ seachange and heightened domestic travel trends. These regional markets have also been more insulated from COVID-19 lockdowns. NSW warehouse markets have tightened due to limited supply and a rise in owner/occupier demand.
While there appears to be good confidence in <$10m market generally, two areas to watch are the CBD retail and office classes that may be affected by tenant performance should there be any delays in opening the economy. Another key factor, particularly in the global employment hubs of Sydney and Melbourne, will be the nature of work practices under “COVID normal” arrangements. It is possible that full-time working from home arrangements are a cyclical change and a recovery will follow. However, we can expect lag effects for up to 24 months if investor resilience and tenant confidence erode despite the relative robustness of the Australian economy.
Government, corporate and consumer responses to the pandemic have informed many of these trends. It remains to be seen how the impact of lockdowns and future government actions will affect the commercial market segments.
DISCLAIMER
This material is produced by Opteon Property Group Pty Ltd. It is intended to provide general information in summary form on valuation related topics, current at the time of first publication. The contents do not constitute advice and should not be relied upon as such. Formal advice should be sought in particular matters. Opteon’s valuers are qualified, experienced and certified to provide market value valuations of your property. Opteon does not provide accounting, specialist tax or financial advice.
Liability limited by a scheme approved under Professional Standards