Author: Ross Turner, General Manager - Commercial & Agribusiness
The headlines
- We have analysed sales from more than 60,000 valuations over five years (Q1 2018-Q4 2022) to extrapolate market insights into industrial (warehouse and manufacturing), office and retail assets in the Australian Small to Medium Enterprise (SME) space. The properties are located in Metropolitan (Capital and Large City) areas within New South Wales, Victoria, Western Australia, South Australia, Queensland and Tasmania.
- Overall, during the five years, the broader SME segment has performed strongly across the board but recent quarters are showing signs of the market easing, particularly within retail and office asset values.
- We have also identified clear net return and asset class trends from our data analysis and market observations. We include these in our commentary.
- For lenders and investors, these data-driven insights provide a clear picture of recent market performance in the SME industrial and commercial asset classes around Australia.
Industrial
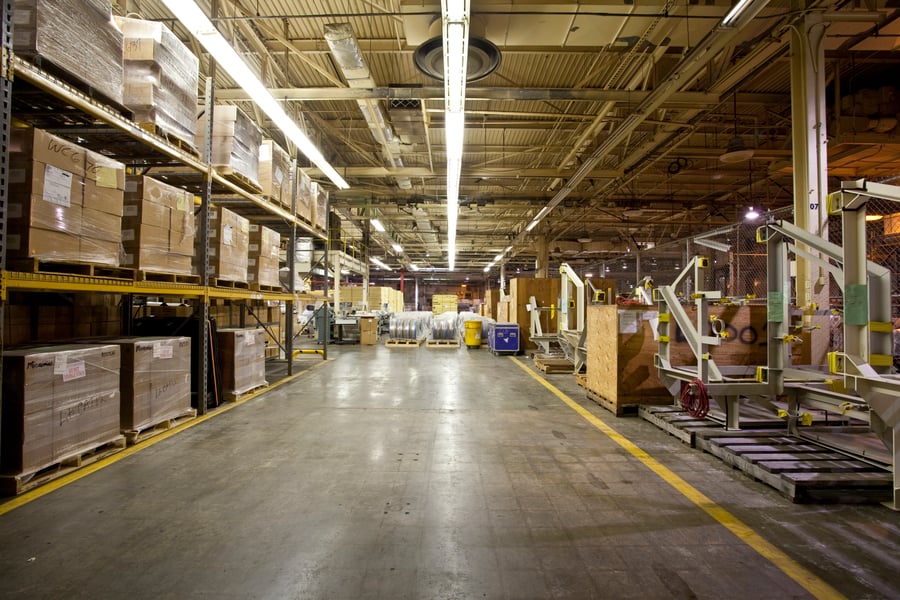
Australia-wide, the demand for industrial assets in the SME Asset category, particularly warehouses, logistic and manufacturing properties, has risen steadily – if somewhat nonlinear – across all markets. This builds on a nearly decade-long trend of demand, which in part can be attributed to the rise in the online shopping habits of Australians. This trend was highlighted in a 2022 Australia Post eCommerce industry report1, which stated "An astounding 73.1% more purchases were made online in 2021 compared to 2019, demonstrating the strong change in shopper behaviour over the past two years."
In most states, but especially in New South Wales and Victoria, values have continued to rise to new record levels. In contrast, Western Australian and South Australian markets are showing signs of easing –so it remains to be seen whether their peaks have been reached.
Last year we questioned whether the strong industrial asset performance could continue due to the flattening arch of median net yields compared to the strengthening performance of Commonwealth Government 10-year bonds. Whilst not reflected in the dataset, we consider there are signs in the growth of rental rates softening off a peak and this along with softening net yields will have an increasing impact on placing downward pressure on value levels.
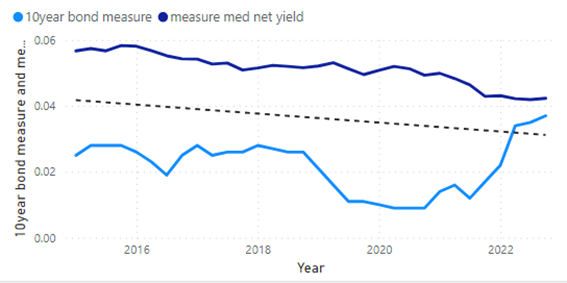
Fig 1: Industrial / Warehouse Median Net Yield vs. 10yr Bond Rate
Industrial lettable area rates
Analysis from the Opteon five-year dataset shows overall consistent growth in lettable area rates across the country, with an average of 50.3% over the 5-year period. In the last year, the east coast capital cities and Perth continued to perform strongly, however South Australia and Tasmania showed signs of softening.
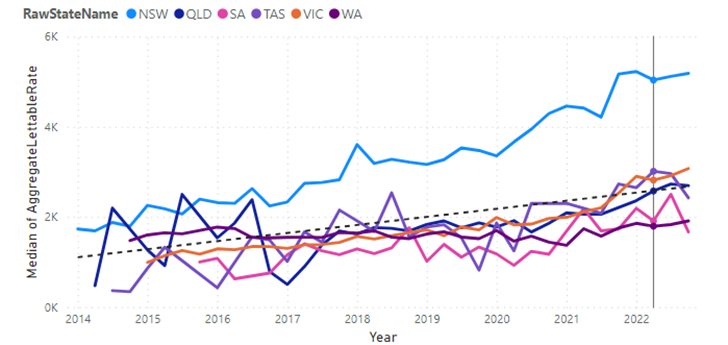
Fig 2: Industrial / Warehouse Median Lettable Rate (note: these figures are $/sqm)
Fig 3: Industrial / Warehouse Median Lettable Rate by state
Over the past five years, the most significant growth has been seen in Victoria, which experienced a rise in average lettable area rates of 95.9%, followed by Queensland at 66.2%. In contrast, WA experienced the lowest level of growth in average lettable area rates for the same period.
While we anticipated industrial lettable area rates were stabilising last year, they have continued to perform strongly. Consider however that rental growth will start to slow and, with a softening yield profile, will stabilise values.
Industrial yields
For the past five years, industrial median net yields compressed around 100bps (1%) over the last 5 years. The exception was NSW which has maintained a consistently tighter yield profile due to development potential of Sydney located industrial property (South Sydney/Inner West in particular for SME assets). Yield compression has been the weakest in WA and the strongest in QLD.
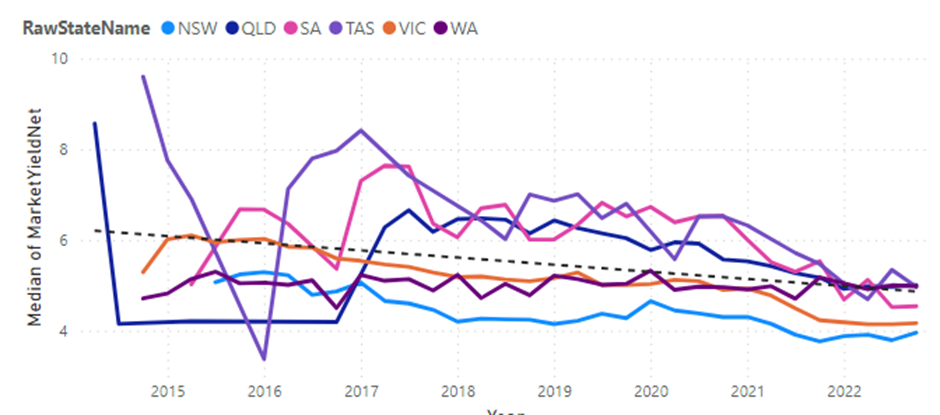 Fig 4: Industrial / Warehouse Median Net Yield
Fig 5: Industrial / Warehouse Median Net Yield by State
Office
Over the past five years, the SME office market has experienced its highs and lows – in part due to the pandemic and the way it has reshaped working arrangements. Brisbane is currently the best performer from a mixed bag of results, with Melbourne having softened more than other markets. Sydney, whilst softening, is performing stronger than its institutional office peers, due to higher demand for smaller floor plates and office space in popular mixed use suburban precincts.
Unlike industrial assets, the spread between SME commercial office yields and 10-year Commonwealth Government Bonds is starting to expand, highlighting the perceived and evident market risks in this asset class.
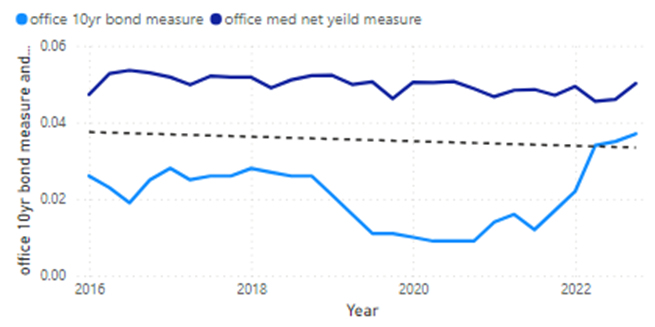
Fig 6: Office Median Net Yield vs. 10yr Bond Rate
Median lettable area rates
While the average increase in median lettable area rates for SME offices across the country over the past five financial years grew by 35.9%, results in the Tasmanian, South Australian and Western Australian markets show less of a trend due to lower sales volumes and wide spread of office grade and location.
Victorian lettable area rates were strongly impacted by pandemic-related shutdowns. While they started to see a recovery in early 2022, in Q4 they again dropped due to the sustained deferred return to office and increased supply.
Sydney median lettable area rates have risen 79.9% over the past five years. Whilst rates are softening, and the broader market for office (specifically institutional grade office) has notably been in decline, the switch to smaller office space requirements from the SME segment somewhat insulated the strata and lower value commercial office market in comparison to its larger institutional peers.
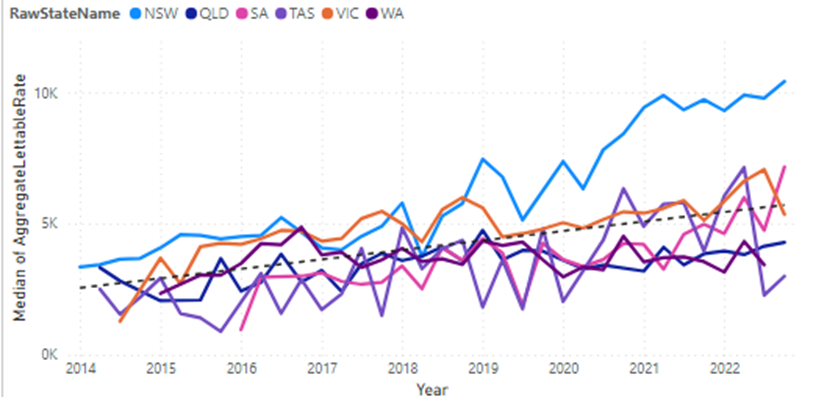
Fig 7: Office Median Lettable Rate (note: these figures are $/sqm)
Fig 8: Office Median Lettable Rate by state
Office yields
Over the past five years, there has been a steady tightening of yields, but the largest improvement has been in South East Queensland, notably Brisbane, with tightening vacancy rates across the most recent quarters. Melbourne markets have shown solid evidence of softening, with SA and TAS results fluctuating from lower numbers of sales of varying composition.
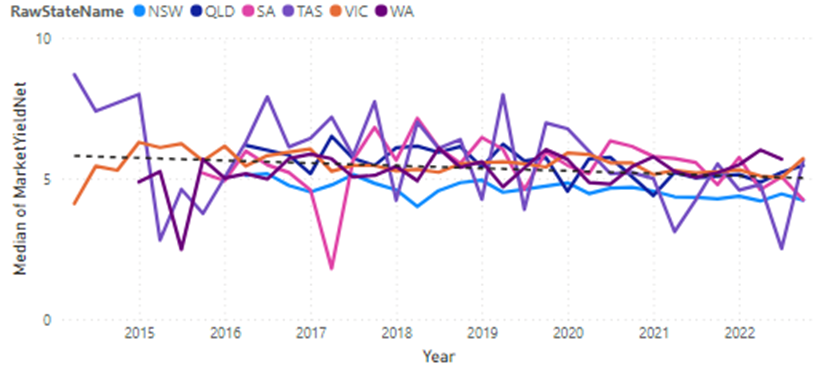
Fig 9: Office Median Net Yield (note: these figures are %)
Fig 10: Office Median Net Yield by state
Retail
The rebound in retail assets that we saw at the end of FY22 Q2 started to reverse in the last half of the financial year. This is likely to reflect the impact on retail assets of rising inflation and the Reserve Bank’s response to it. As Deloitte Access Economics recently stated: “The retail recession that has been foreshadowed by Retail Forecasts for some time has arrived. Real retail turnover in Australia fell again – by 0.6% over the March 2023 quarter – locking in a retail recession after the 0.3% decline in the December quarter of 2022.”2
The societal uptake of online shopping is also likely to be a significant contributor to retail property performance and the narrowing gap between retail median net yields across the country and the Commonwealth Government 10-year bonds.
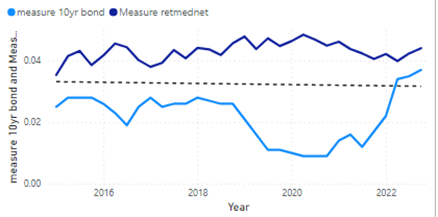
Figure 11: Retail Median Net Yield vs. 10yr Bond Rate
Median lettable area rates
Across the past five years, there has been a 64.8% increase in retail median lettable area rates – despite recent inflation-related falls. Over the five-year window, the gains were particularly strong in Queensland (89.5% over the five-year period), with earlier growth in NSW and VIC showing evidence of decline in recent quarters.
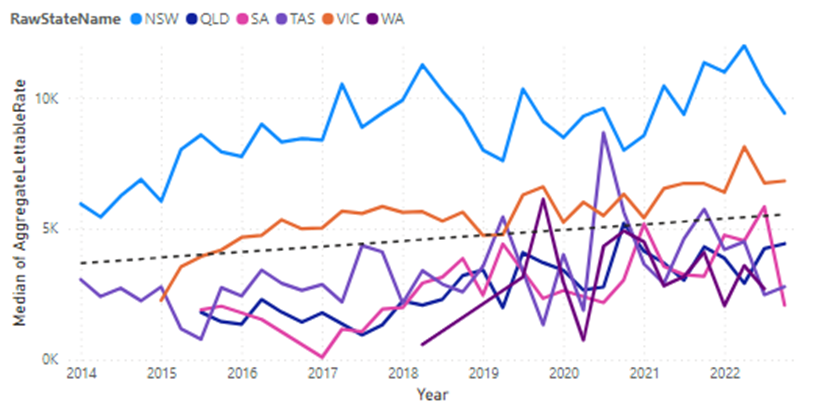
Figure 12: Retail Median Lettable Rate (note: these figures are $/sqm)
Figure 13: Retail Median Lettable Rate by state
Retail yields
There has been a steady tightening of yields across the country since FY18, most prevalent in QLD and SA, with TAS results an anomaly for Q4.
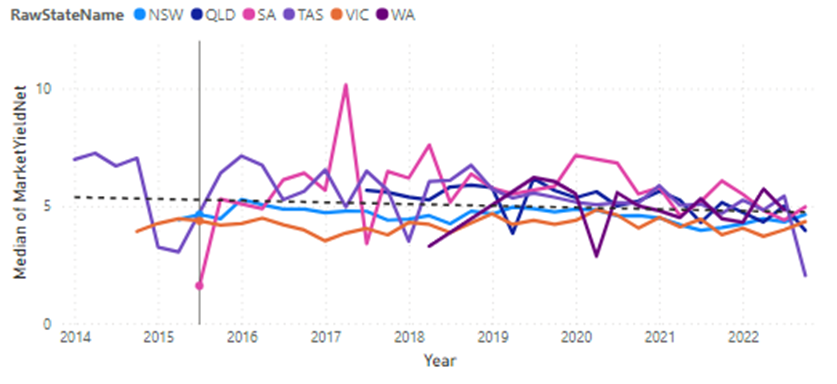
Figure 14: Retail Median Net Yield
Figure 15: Retail Median Net Yield by state
The impact of current financial conditions
The five-year picture clearly shows how inflationary impacts to value (through increases in rental rates, but also higher outgoings expenses), changing interest rate environment and the current economic conditions have had on SME commercial assets across Australia. As sales data catches up with the market, we expect the softening to continue over the short to medium term.
While there are signs Australian inflationary pressures are starting to ease, the global economy continues to buffer the local market. With the corresponding increased costs of funding and construction, serviceability and financial development hurdles may see more investors turn to the risk-free returns offered by government bonds or other alternate defensive investments.
It is also possible there will be a spike in deleveraging due to unsustainable debt. This may cause an increase in supply at a time when rental growth is showing signs of softening and investor appetite is waning. Whilst there will always remain pockets of various sub -markets that defy this broad trend due to increased competition for defensive style assets, we anticipate this combination of factors will put pressure on the SME sector – particularly in the short-term and create a widening gap in both appeal and values between prime and secondary assets.
Source links:
1: https://auspost.com.au/content/dam/auspost_corp/media/documents/ecommerce-industry-report-2022.pdf
2: https://www.deloitte.com/au/en/about/press-room/retail-forecasts.html
Ross Turner
General Manager - Commercial & Agribusiness
0435 039 847