Author: Ross Turner, General Manager Commercial and Agri
The headlines
- Opteon’s in-house data analysts have analysed more than 22,000 of our valuations (Q2-2019 – Q2-2022) with insights extrapolated for commercial (retail and office) and industrial (warehouse and manufacturing) assets in the sub $15 million asset class. The valued properties are located in NSW, Victoria, WA and Queensland.
- Overall, in the past year, the sub $15m industrial and commercial market has continued to perform strongly across the country.
- From our data analysis and market observations, we have also identified clear market trends regarding asset class performance and yields. We include these in our commentary.
- For investors and financiers, these data-driven insights provide a clear picture of recent market performance in the sub $15m industrial and commercial asset classes.
Industrial
The demand for industrial assets in the sub-$15 million category, particularly warehouses and logistic properties, has continued – no doubt helped by online shopping habits formed during the pandemic. Yields in the eastern states have continued to fall more sharply still in the last 12 months than in previous years.
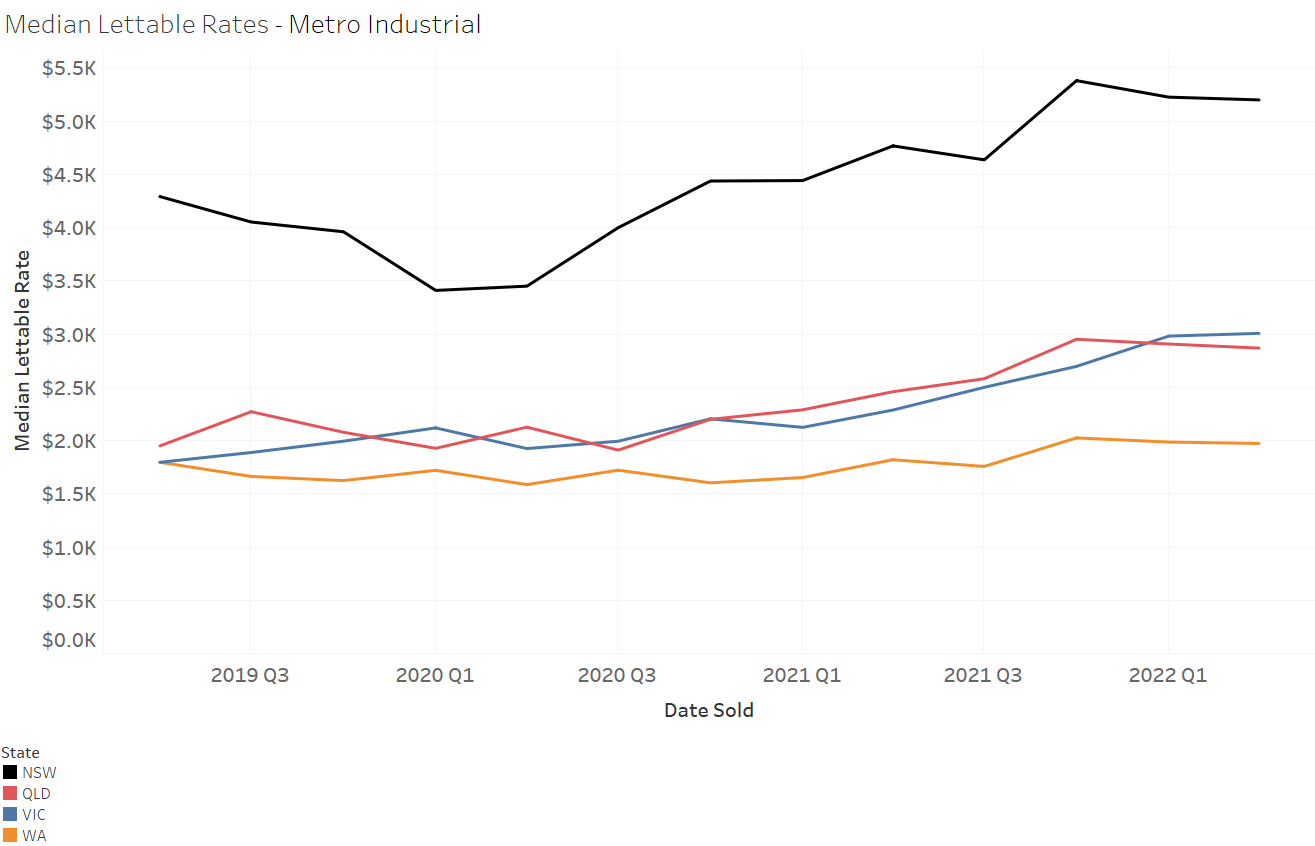
The industrial sector’s strong performance is reflected in the increased lettable area rates they are attracting across Australia. These have been most significant in Melbourne, Sydney, Brisbane and in regional NSW and Victoria.
In our annual review last year we wondered whether the industrial asset class would provide the best upside in 2022. We now have our answer.
The new question is whether this performance can continue given the flattening arc of median net yields against the strengthening of the Commonwealth Government 10 year bonds. Commonwealth bonds tripled between Q2 2019 and Q2 2022 to 3.8% – just 0.3% lower than industrial yields in Sydney and 0.4% lower than industrial yields in Melbourne.
Lettable area rates
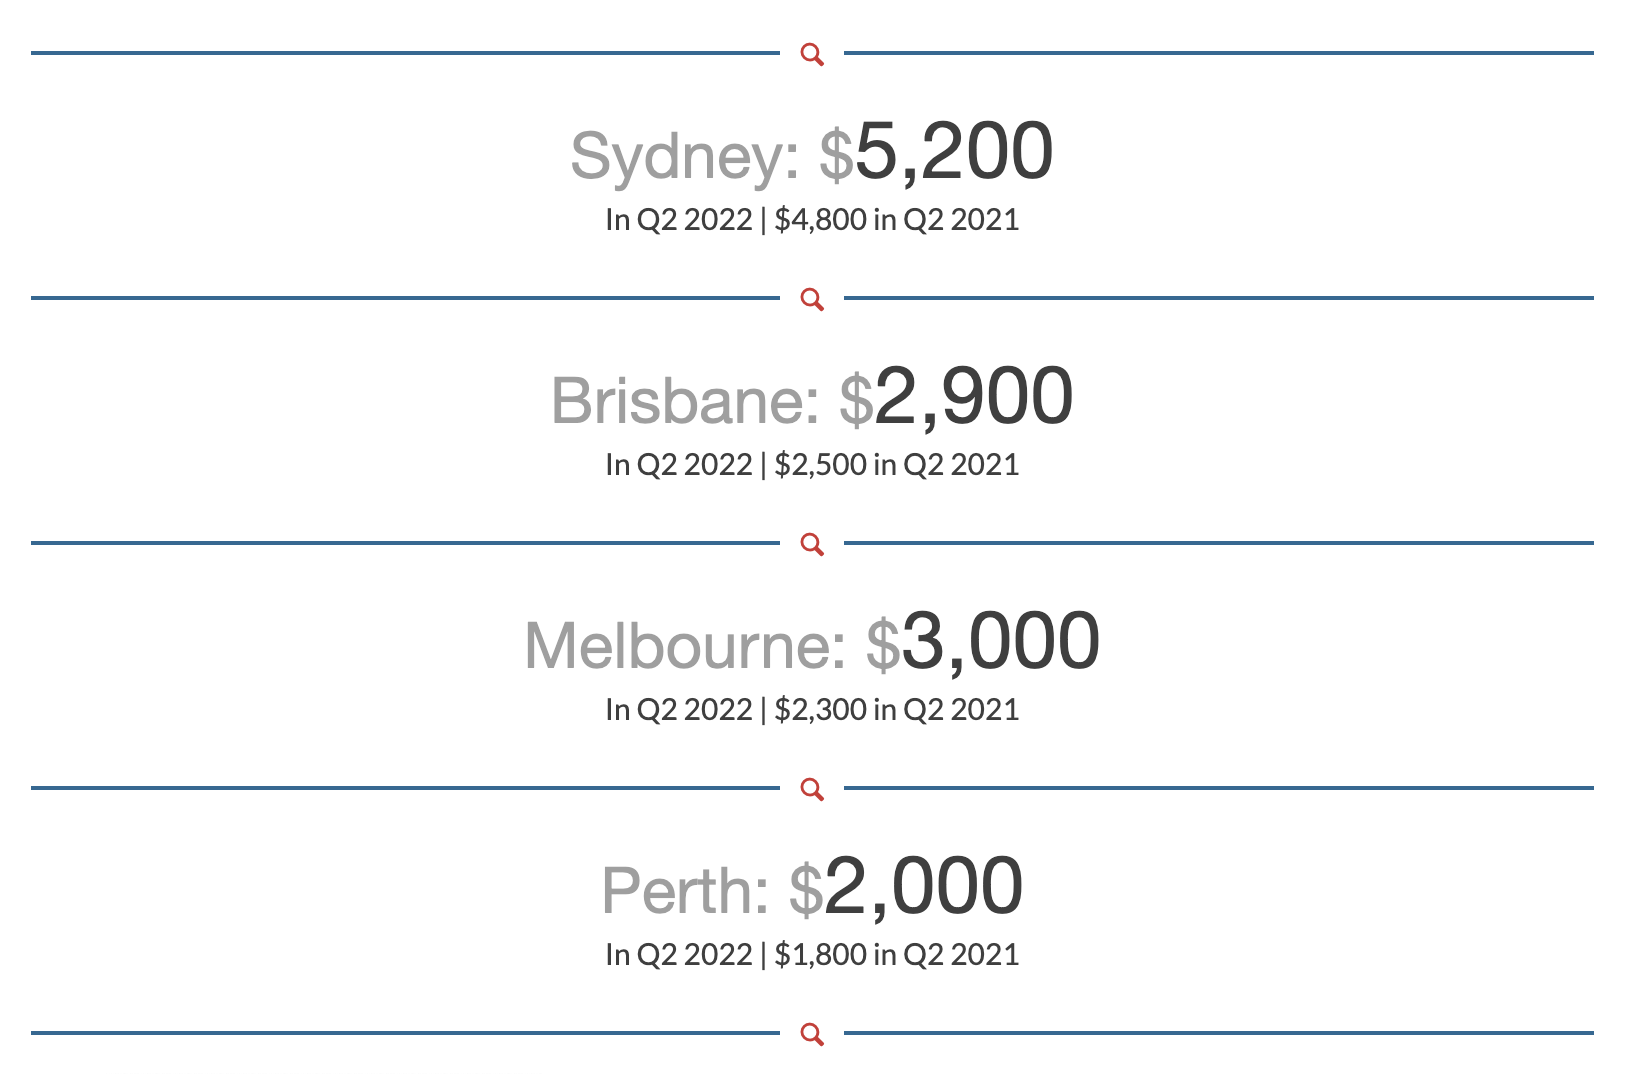
Over the past year, sales analysis from the dataset has shown increased lettable area rates in Melbourne (+31%), Brisbane (+17%), Sydney (+9%) and Perth (+8%), particularly in the prime metro markets on the eastern seaboard.
Note: These figures are $/sqm and have been rounded to the nearest 100.
Sydney lettable area rates were highest in the parts of the city around Port Jackson Bay – Eastern, Inner, Inner Western, Central Western, Canterbury-Bankstown, Lower Northern Sydney and the Northern Beaches – where rates were $6,700 in Q2 2022, compared with $5,000 across the rest of Sydney.
When contextualised within the previous two years of strong growth (+51% Sydney, +35% Brisbane, +56%, Melbourne and +24% Perth), these results indicate median lettable area rates for industrial assets within the metro areas are showing signs of stabilising.
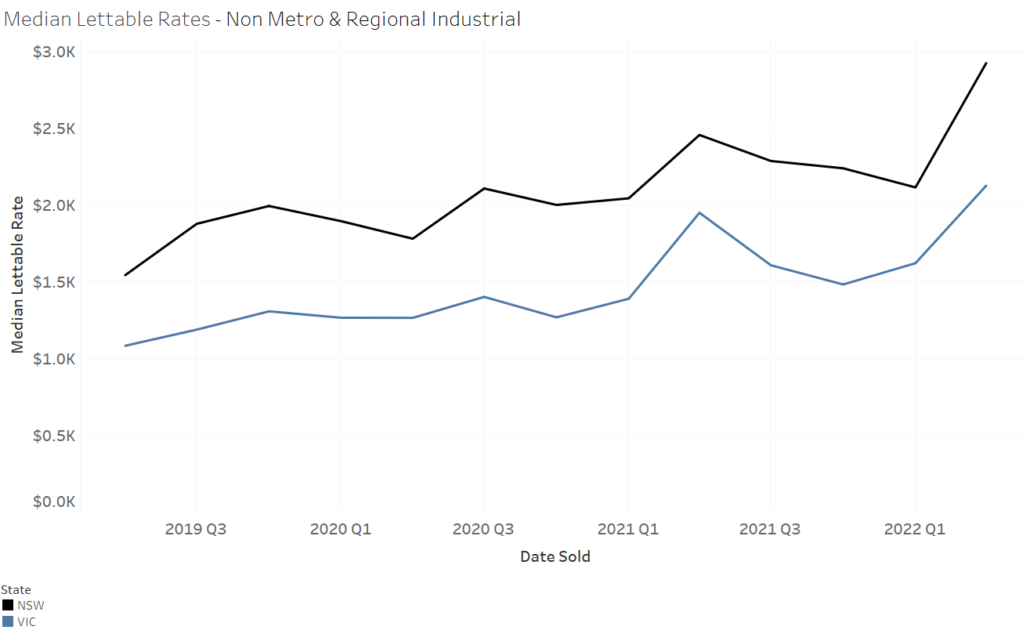
There have also been increased lettable area rates in the past year across non-metro and regional areas in NSW (+21%) and Victoria (+9%). As with the metro industrial assets, this growth follows years of strong growth as shown by a change in median lettable area rates over the past three years of +99% in NSW and +96% in Victoria.
Note: These figures are $/sqm of lettable area and have been rounded to the nearest 100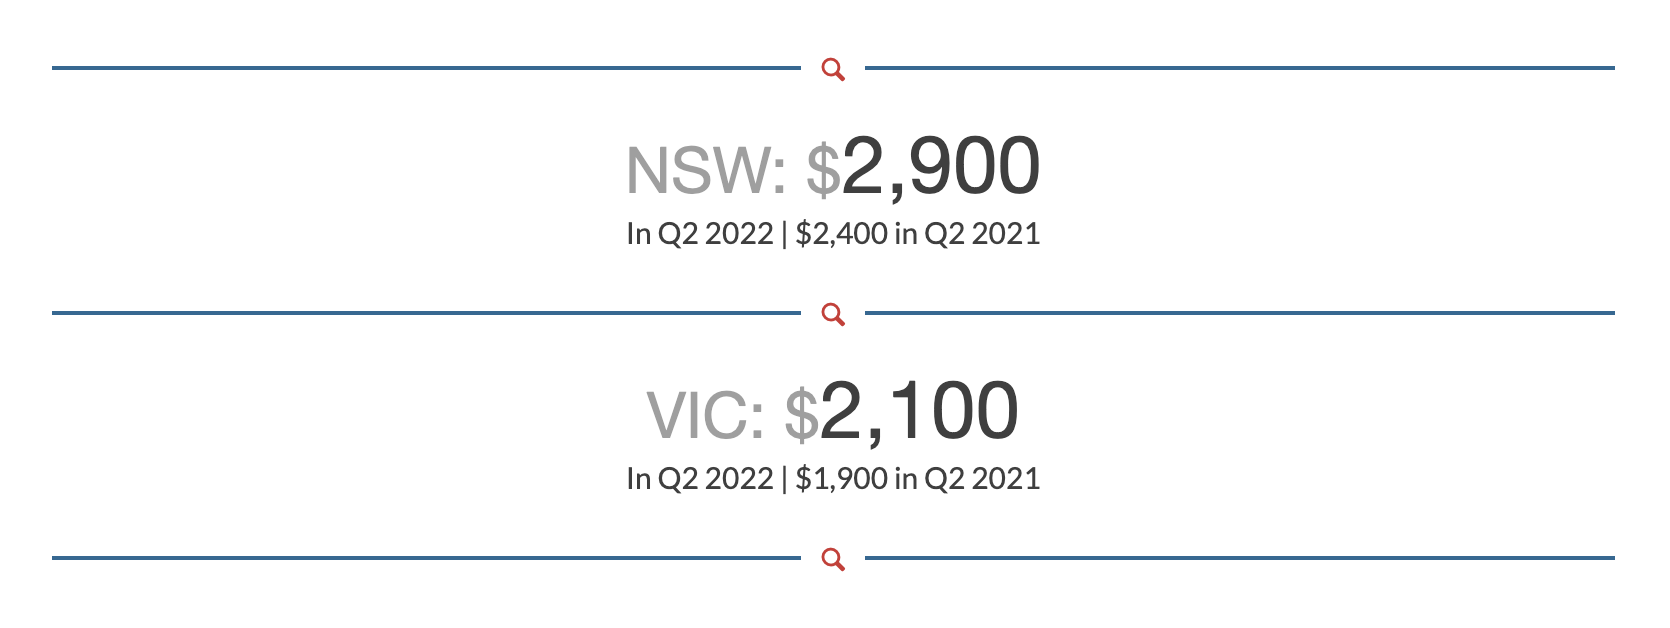
Yield
With median lettable area rates rising across the board and value and prices in some markets still rising, the falling yields we have seen for industrial assets in the sub-$15 million category are not surprising.
In the past year metro median net yields fell the most in Melbourne (-0.5%) and Brisbane (-0.4%), reflecting the significant gains those markets have seen in median lettable rates. Indicative of more modest growth in median lettable rates, Sydney market yields fell slightly (-0.1%) and Perth remained stable. In Q2 2022, median net yields in Sydney were 4.1%, in Brisbane they were 5.4%, in Melbourne they were 4.3% and in Perth they were 5.3%.
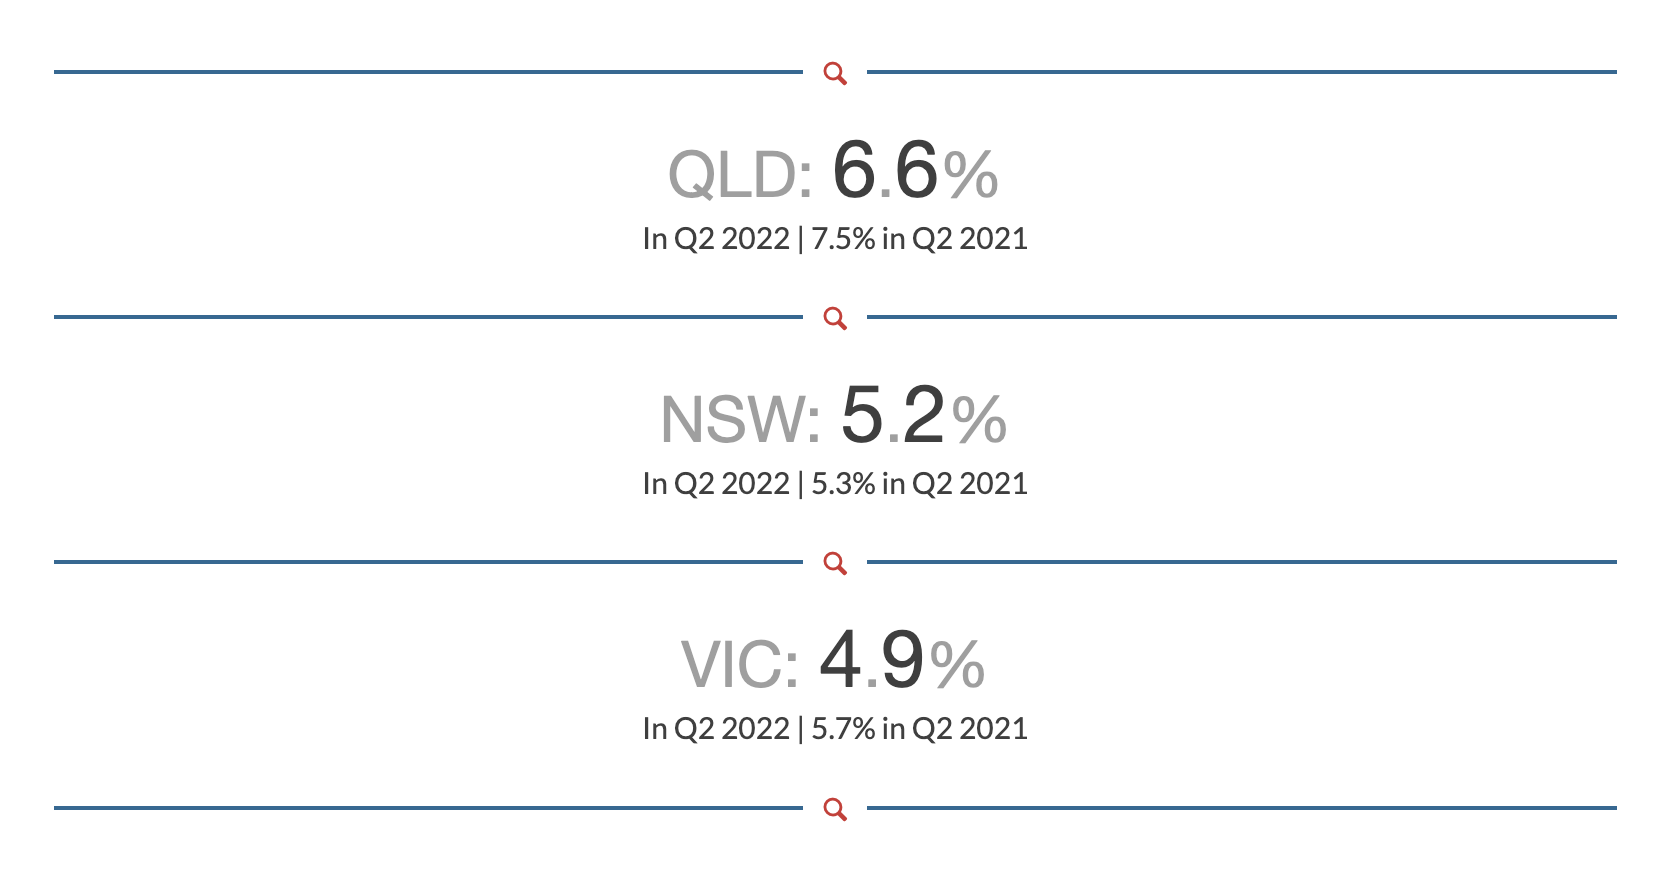
In the regions, yields for industrial assets continued the downward trajectory they have been on since 2019, with NSW seeing a drop of 0.7% (-1.4% over three years) and Victoria seeing a drop of 0.4% (-0.6% over three years). In Q2 2022, median net yields in regional NSW were 4.8% and in Victoria they were 5.4%.
With the yield curve starting to flatten, value growth is expected to soften, as even significant rental growth is unable to sustain values in a market of softening yields, particularly when they have been at historically low levels. Secondary grade assets are also likely to be impacted particularly those that have transacted in the previous 12-18 months.
Retail
In the retail space, there has been an increase in median lettable area rates, including particularly strong growth in suburban areas of Sydney and Brisbane.
Lettable area rates
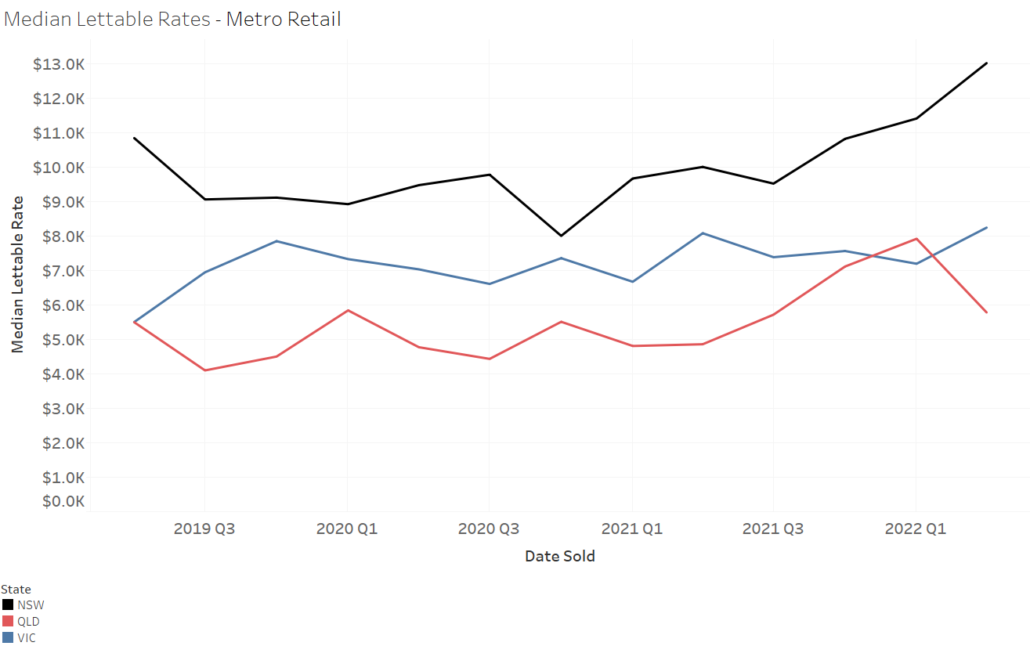
In the retail space, there has been an increase in median lettable area rates in the eastern capital cities. Demand for well positioned suburban retail assets has been particularly strong in Sydney (+30%) and Brisbane (+19%). Lettable rates remain the highest in Sydney – more than double that in Brisbane.
Note: These figures are $/sqm of lettable area and have been rounded to the nearest 100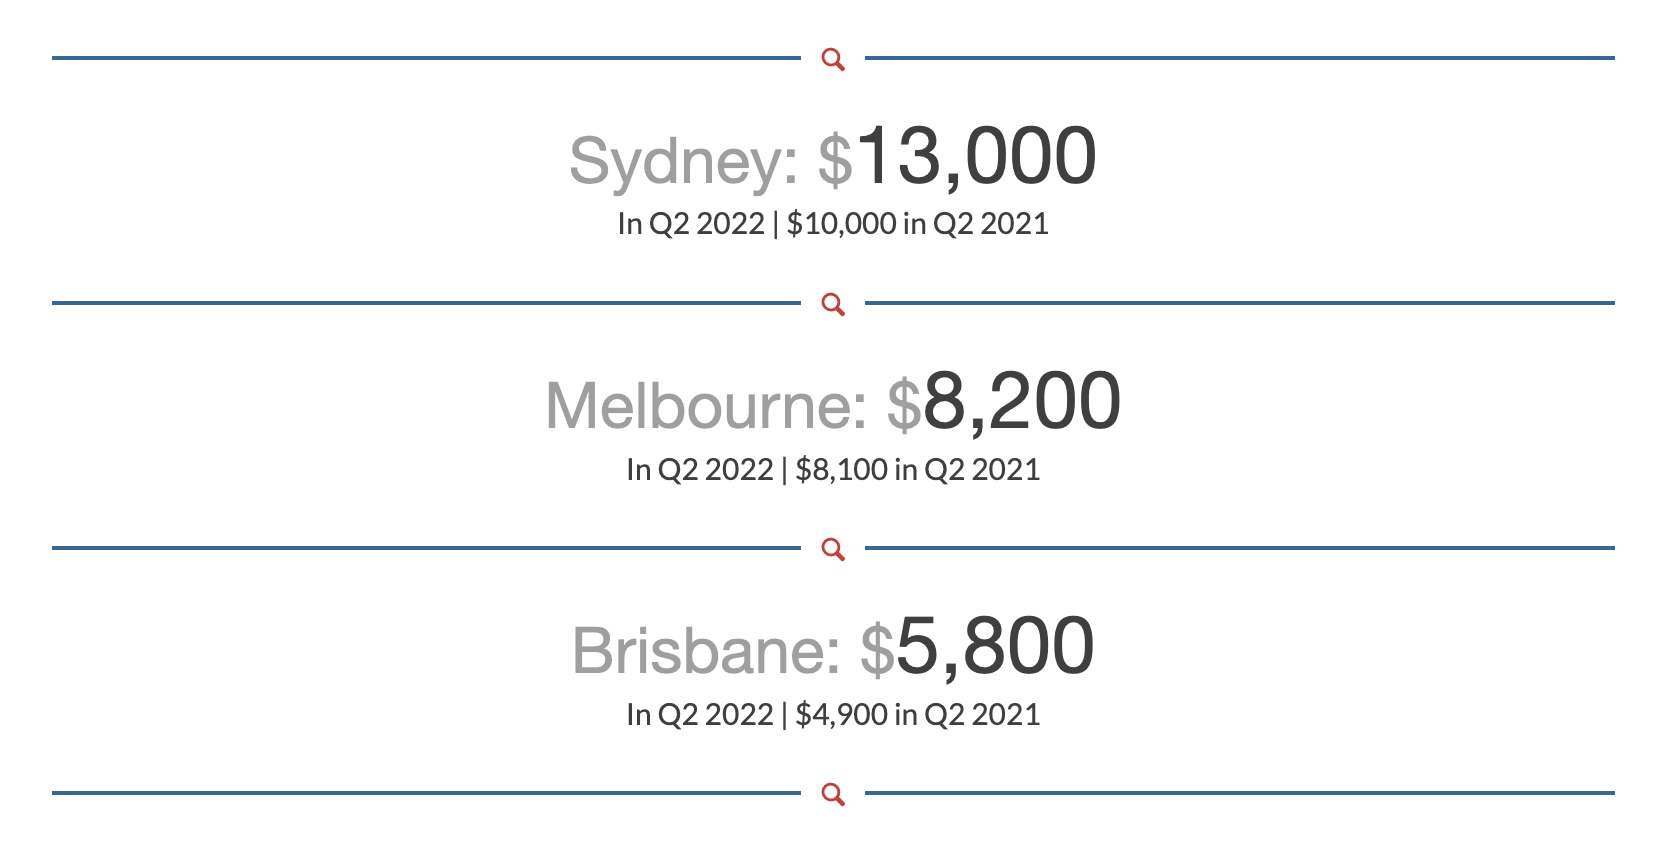
In the non-metro and regional areas, median lettable area rates for retail assets have grown 20% in NSW and 45% in Victoria.
Note: These figures are $/sqm of lettable area and have been rounded to the nearest 100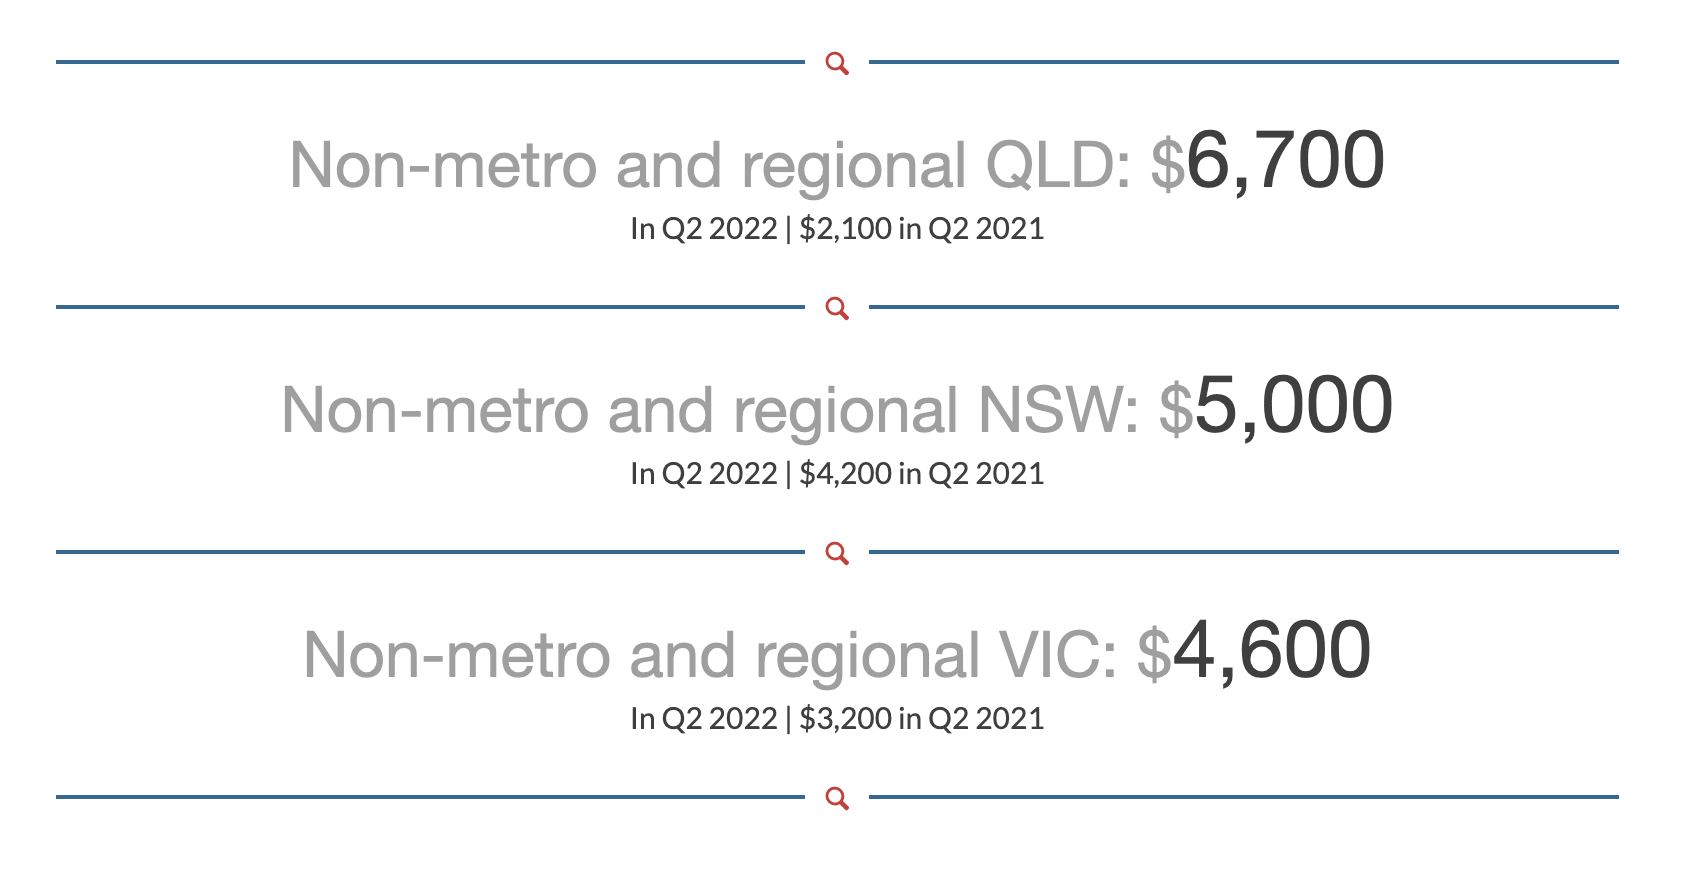
Yield
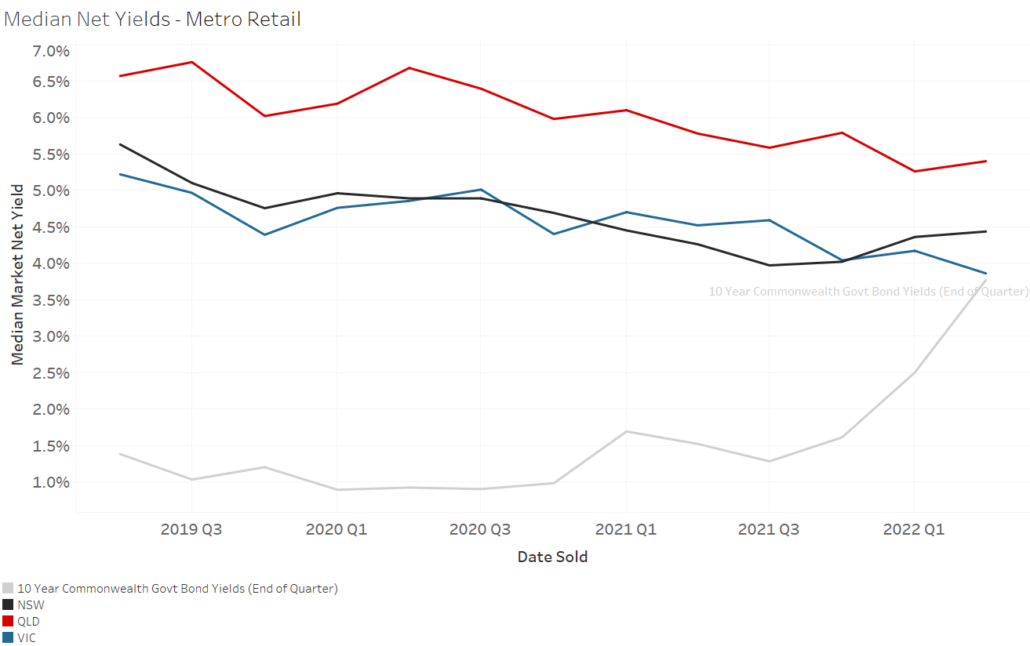
There has been a steady tightening of net yields in the eastern capital cities over the past three years. Retail yields in Melbourne (-0.7%) and regional Victoria (-0.8%) and Queensland (-0.9%) have firmed the most over the past year.
Note: These figures have been rounded to the nearest 100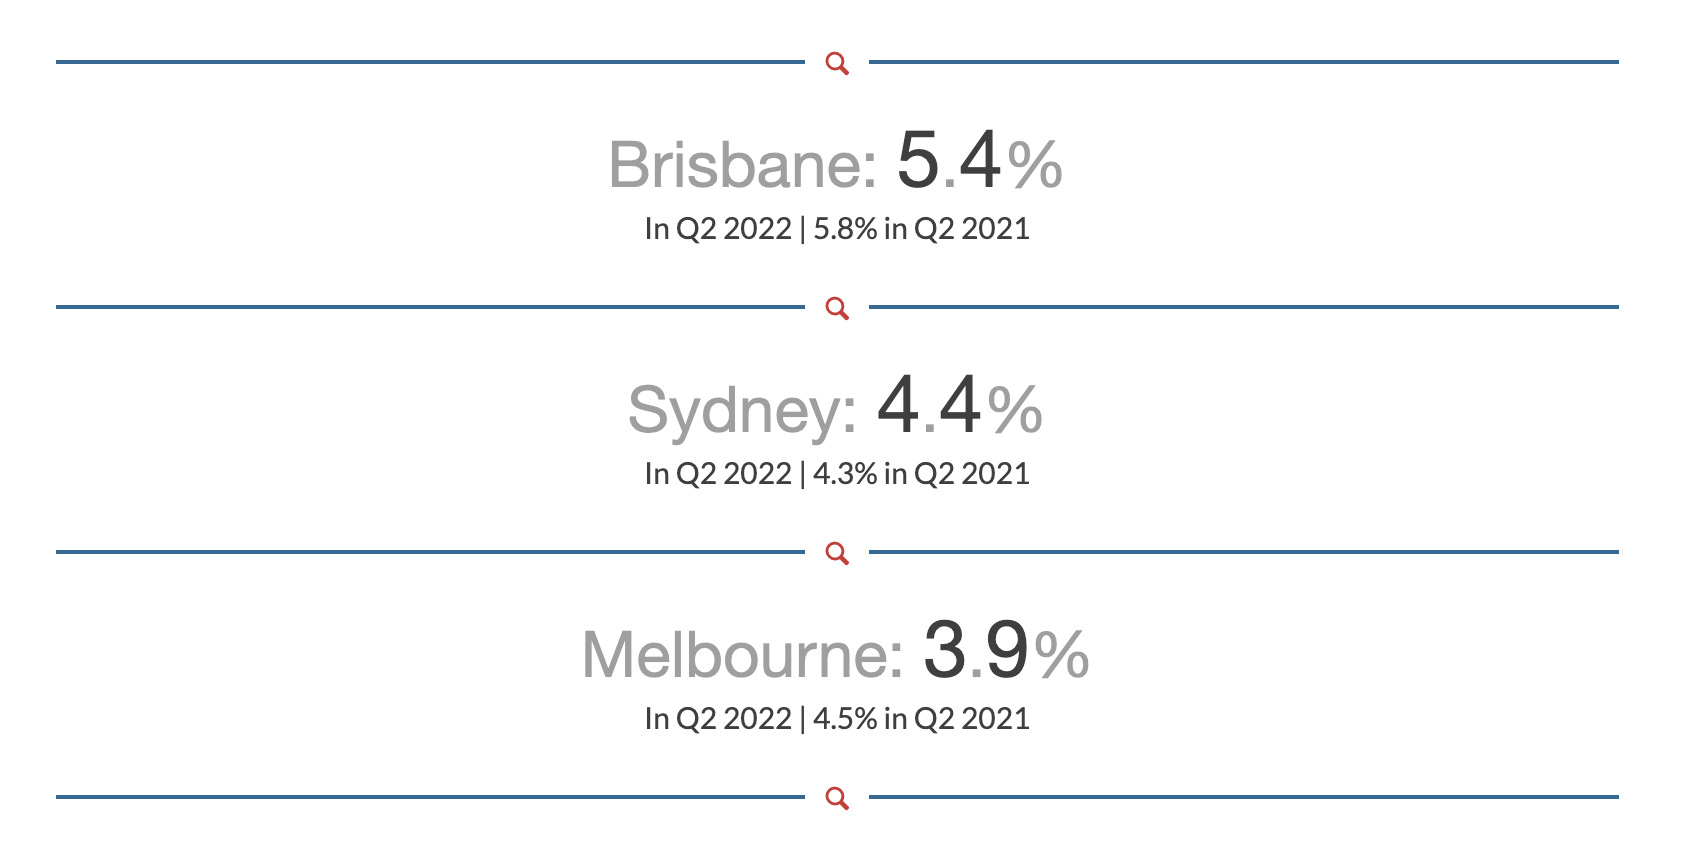
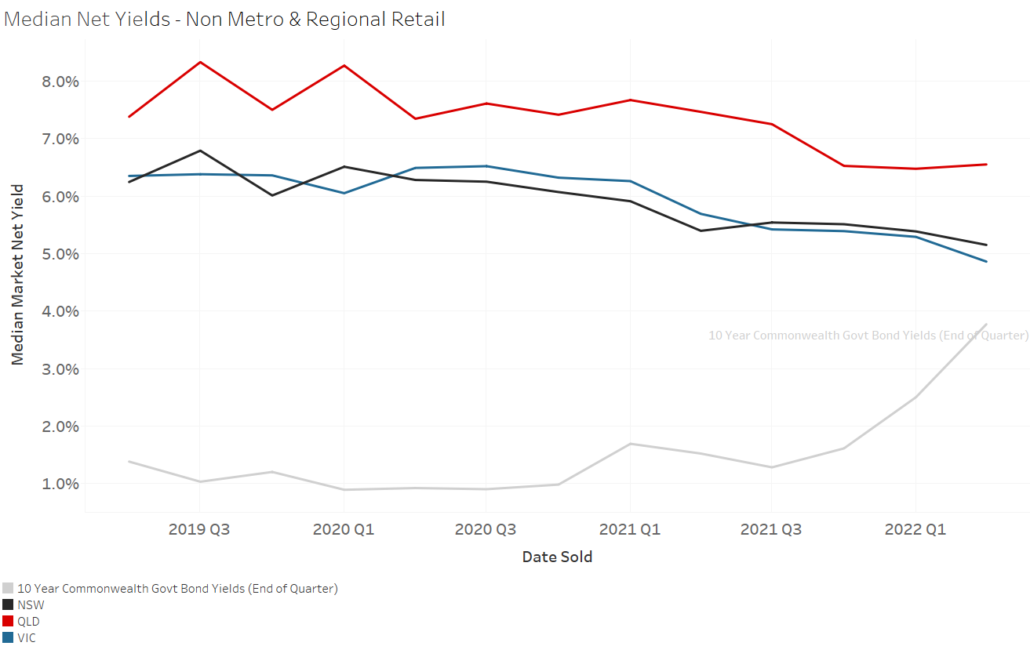
Retail yields have also been tightening in non-metro and regional areas over a three year period in Victoria (-1.5%), NSW (-1.4%) and Queensland (-0.8%).
Note: These figures are $/sqm of lettable area and have been rounded to the nearest 100
Office
Overall, the locational characteristics of the office property markets remained strong throughout the year. This suggests office markets have performed well post JobKeeper, which has been aided by many employers moving towards hybrid working arrangements.
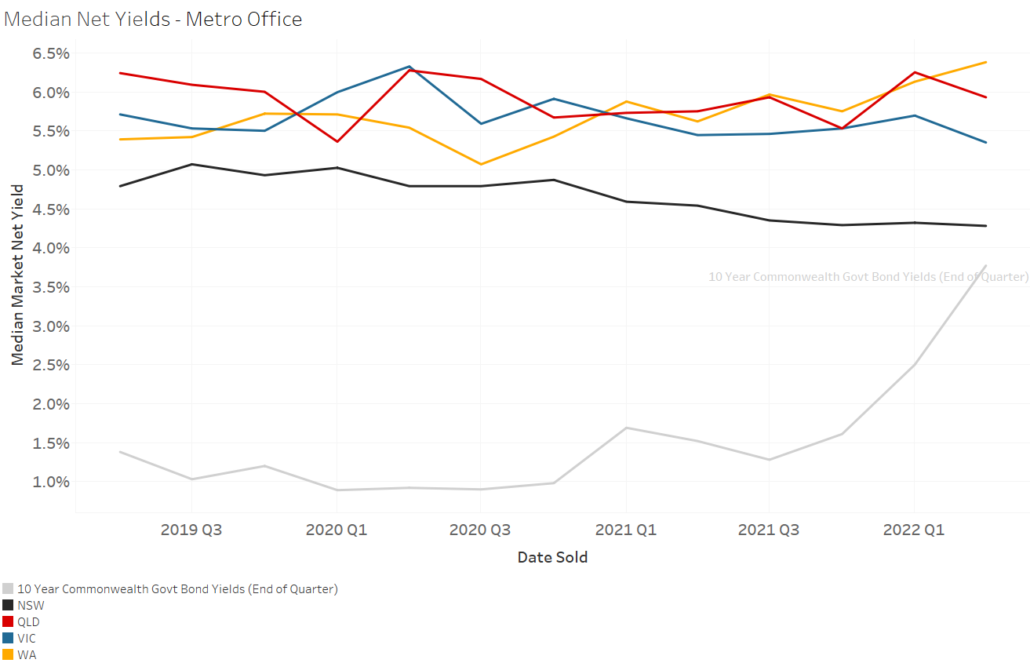
However, with Sydney office yields just 0.5% higher than Commonwealth government bonds, indicates future reprising (softening) of yields and a likely softening of value levels unable to be sustained by any real net increases in effective rent.
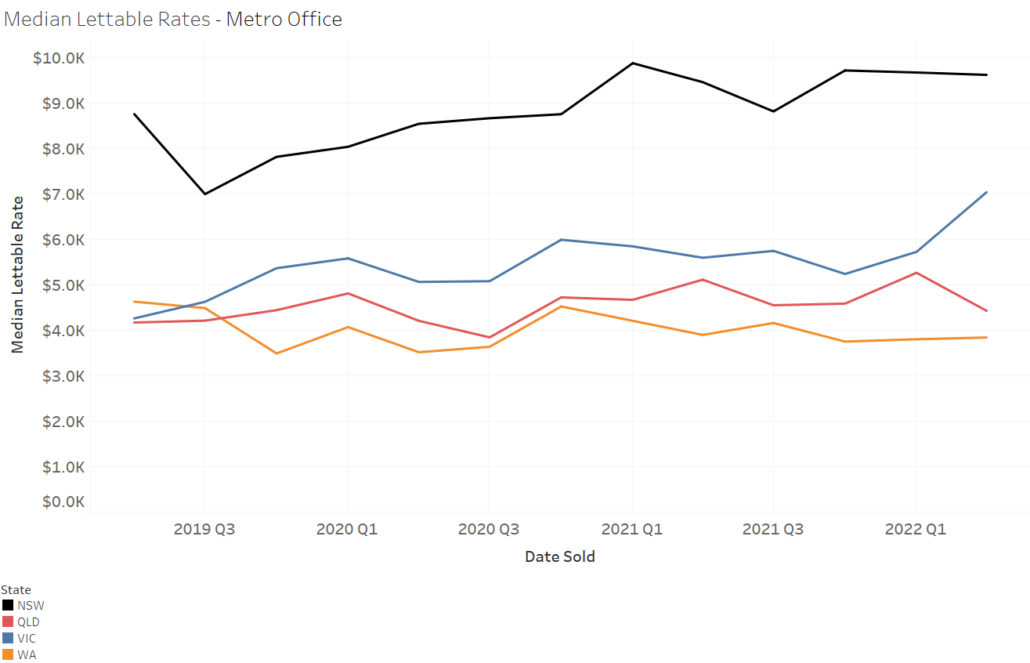
Lettable area rates
In the office <$15m category, there has been an increase in median lettable area rates in the Sydney and Melbourne, with Melbourne assets performing the strongest with a +26% lift on last year’s numbers. There was little change in Perth over the year (-1%) and Brisbane is due to compositional change of data.
Note: These figures are $/sqm of lettable area and have been rounded to the nearest 100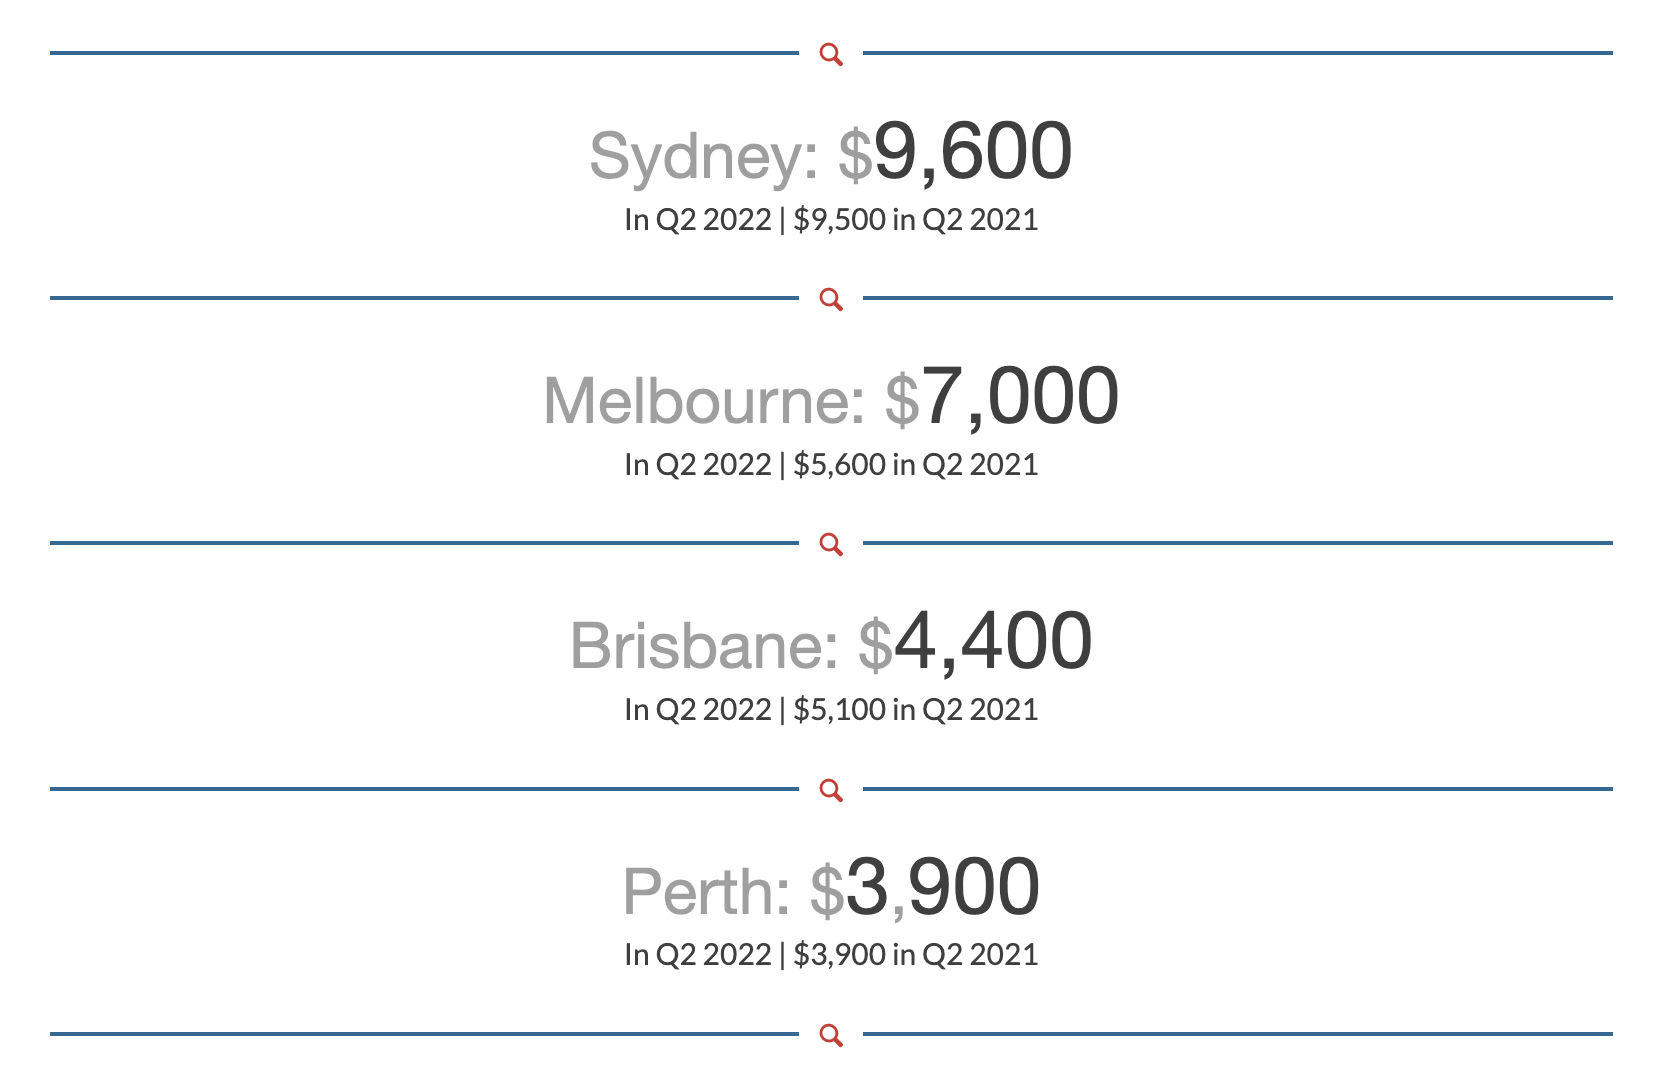
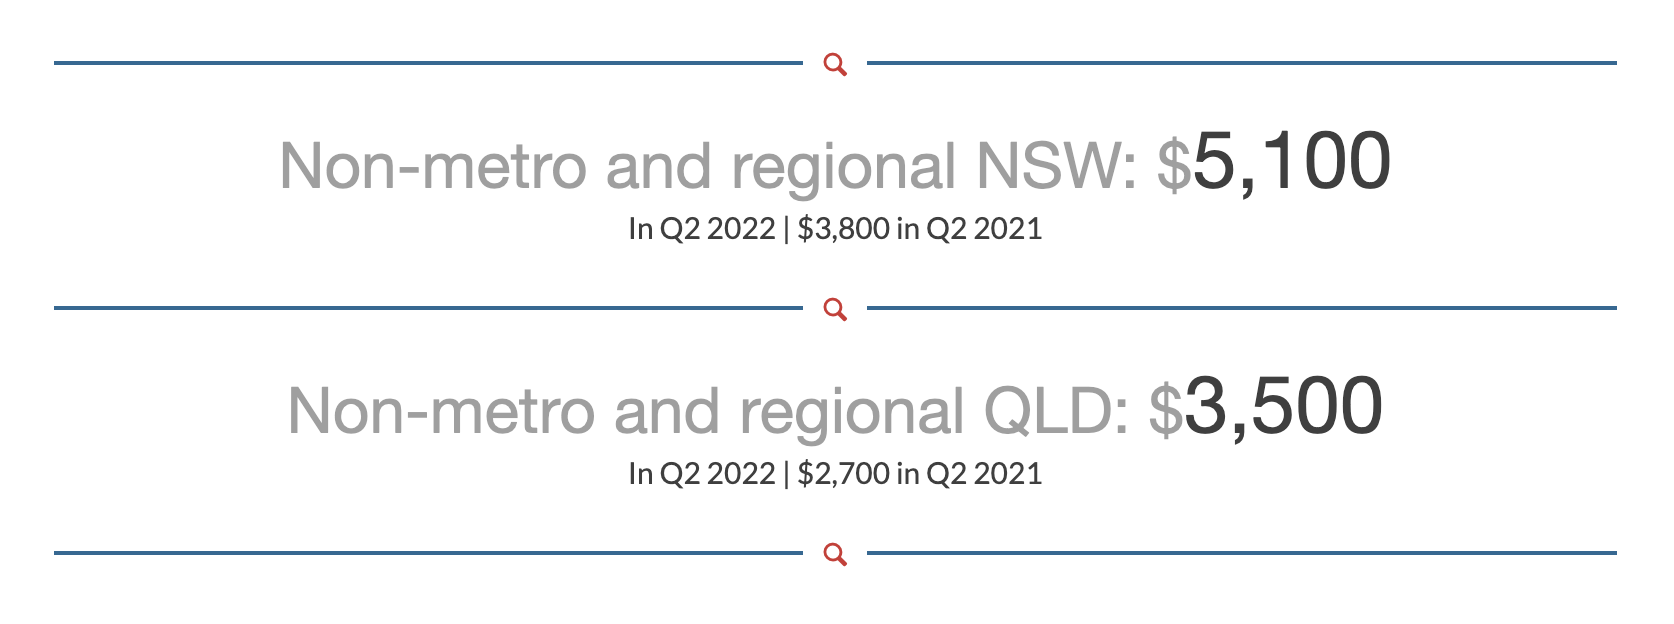
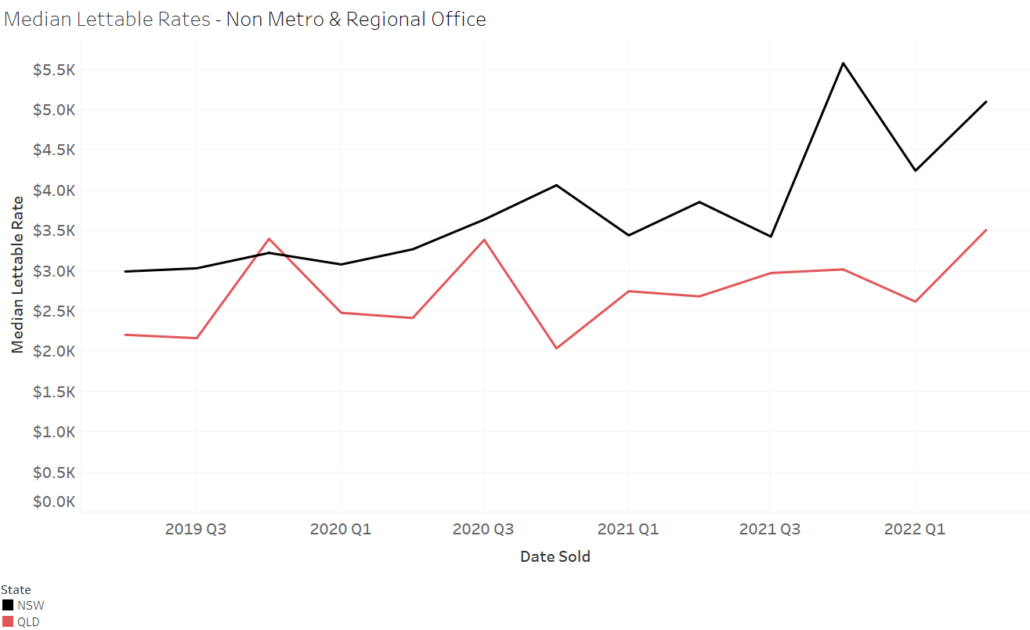
In NSW (+32%) and QLD (+31%) there has been a strong rise in lettable arearates for offices in non-metro and regional areas. In every quarter for three years (except Q4 2019), median lettable area rates for NSW regional office assets have been between $200 and $2,600 higher than in QLD.
Note: These figures are $/sqm of lettable area and have been rounded to the nearest 100
Yield
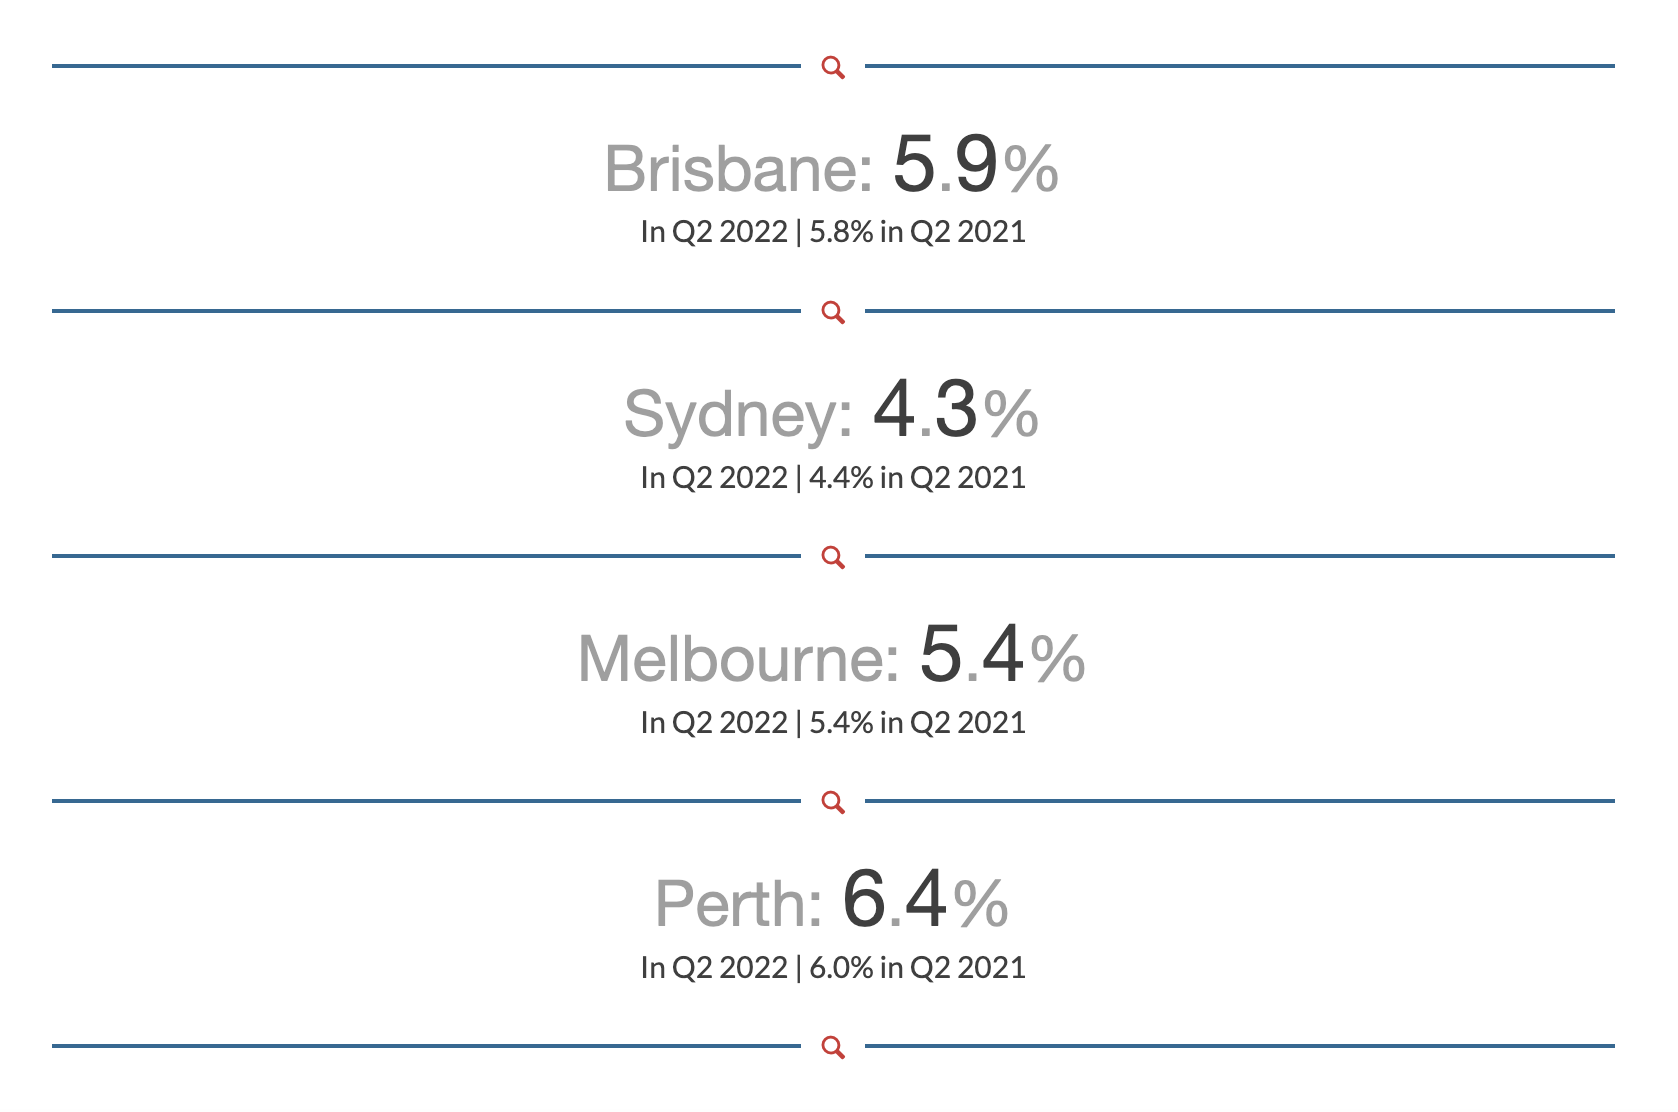
There has been a steady tightening of office yields in in Sydney over last three years. Other cities have experienced more volatility, particularly during the pandemic-influenced 2020. During the past two years, yields dropped in Melbourne and rose in Perth.
Note: These figures have been rounded to the nearest 100
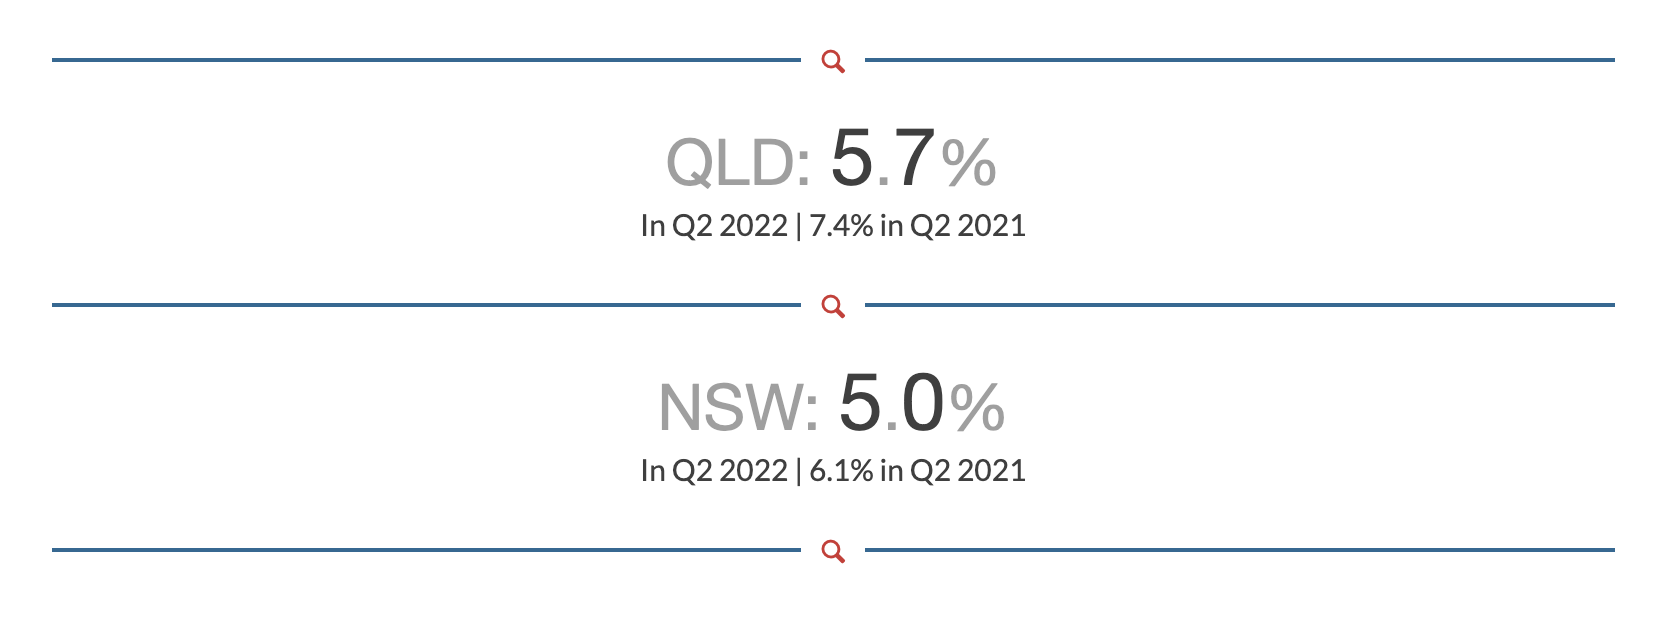
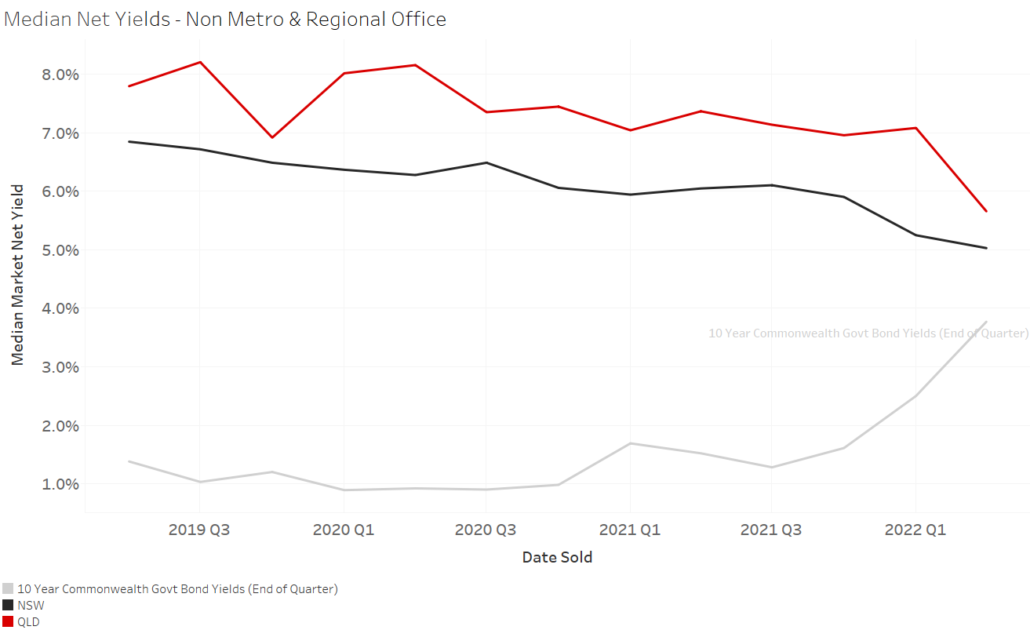
Yields also continue to fall in non-metro and regional NSW and Queensland.
Note: These figures have been rounded to the nearest 100
Current trends
The last 12 months have shown a positive story across metropolitan and regional markets. All markets follow a cycle and we observe that the cycle has now turned.
In terms of median lettable area rates, Sydney has again outperformed the other markets in every quarter across the asset classes. However, there has been a shift in regional performance with Queensland median lettable rates for retail assets becoming the highest in the country.
Yields have tightened the most for office assets (-1.7%) and retail assets in regional Queensland (-0.8%). The Queensland regional market is performing strongly due to the post Covid-19 migration trend as the state has opened up post lockdown.
Increased cost of funding will lead to higher return expectations for commercial property when considering the risk free returns from government bonds. Existing levels of debt held against security values of commercial property may not be sustainable and deleveraging is likely to occur. Whilst increases in effective rents have somewhat held the growth story (particularly in industrial), this trend is unlikely to continue and the next 12 months will see a softening in values in commercial markets, most likely to begin with the capital cities in the eastern states.

Author: Ross Turner, General Manager Commercial and Agri
Ross is the General Manager for Commercial and Agri, with over 18 years’ experience in property valuation and advisory across Australia in both metropolitan and regional markets.
Ross has the benefit of having previously reviewed and provided valuation advice from a financier’s perspective in an institutional banking environment. He has considerable experience managing large valuation projects for Government and Corporates across Australia for financial reporting, strategic advisory and mortgage security purposes.
Contact Ross on 0435 039 847

.jpg)

.png)